Your browser cannot save progress right now. You can still investigate; keep this tab open or enable local storage to save.
This case has been updated. Compatible choices are kept; revisit the evidence before drawing your conclusion.
01 · The briefing
Begin with the question.
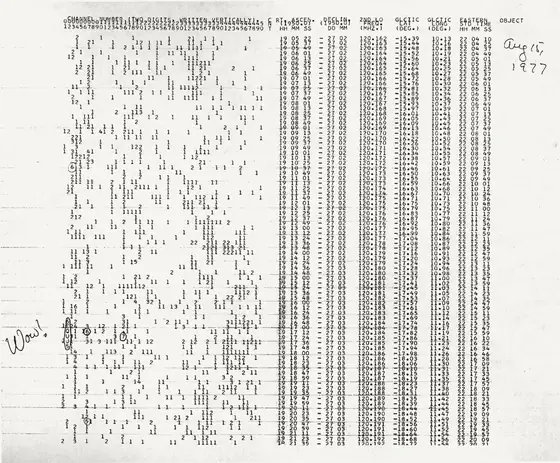
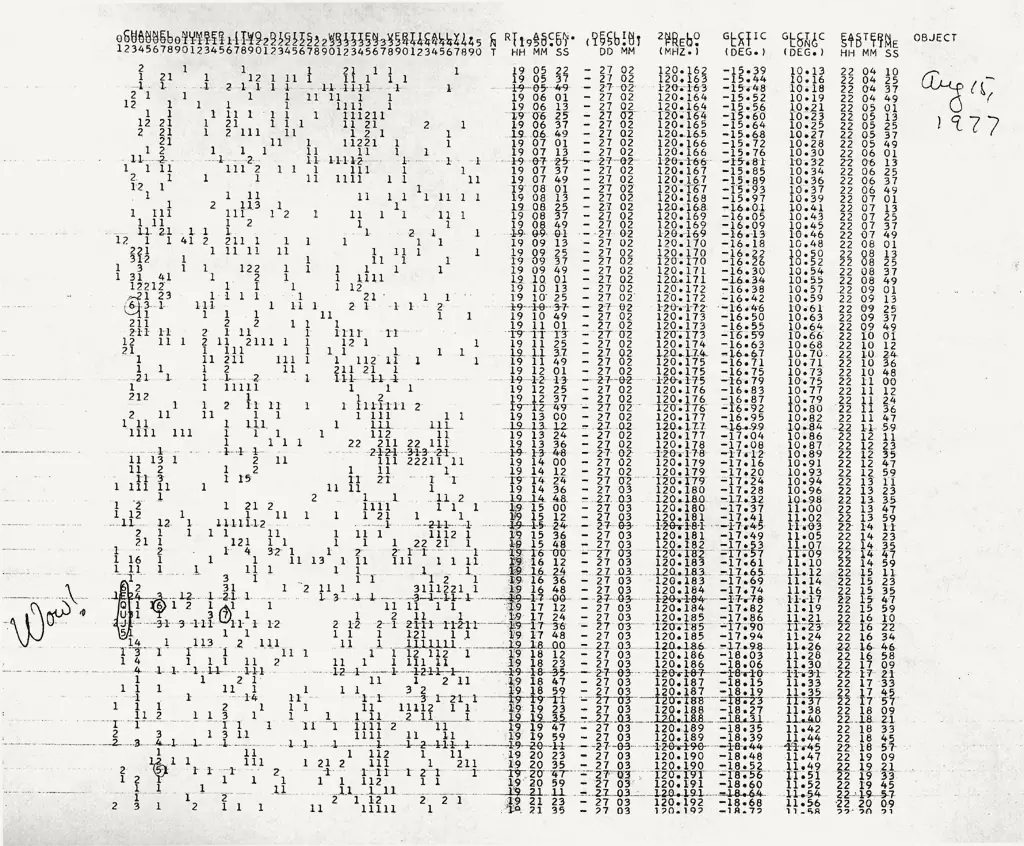
On the night of 15 August 1977, the Big Ear radio telescope at the Ohio State University Radio Observatory recorded a signal in one channel of its computer output. The telescope scans the sky as the Earth turns, and the signal fell close to 1420 MHz, the frequency of the hydrogen line, a radio emission given off by neutral hydrogen gas throughout the galaxy. The printout shows the signal as a string of characters in channel 2, with a handwritten 'Wow!' beside it. Its signal-to-noise value was about 30, but the telescope saw it only briefly and did not see it again when it looked at the same declination over about 30 days.
Explanations ranged from a distant transmitter to an instrument fault to a natural source. Some argued that a civilisation signalling on purpose would be expected to repeat itself. Others pointed out that a single event cannot establish its own source. This case asks what one 72-second detection can and cannot support, and how later searches narrowed the options without closing the question.

The timeline
Big Ear records a narrow signal in channel 2 of its computer output at about 11:16 pm EDT.
Jerry Ehman's written account of the event is drafted, and it is revised in February 1998.
Gray and Marvel publish a Very Large Array search with more than 100 times the original sensitivity, finding no steady narrowband source at the nominal position.
Arecibo drift scans at 1420 MHz run from February to May 2020, in the data later analysed for the Wow! preprint.
Breakthrough Listen observes a candidate star simultaneously with two telescopes and finds no technosignature candidate.
Méndez, Ortiz Ceballos and Zuluaga post a preprint proposing a natural hydrogen-cloud explanation.
A researched reconstruction for learning. These reasoning steps simplify a complex record; no score can capture the full history.
02 · The evidence
What does the record show?
Read each exhibit before settling on an explanation. The source links below every exhibit lead to the record behind it.
Exhibits reviewed 0 of 4
What the detection recorded
Ehman's archive account gives a signal-to-noise value of 30.5 plus or minus 0.5 and says the signal came in six significant readings of about 12 seconds each, adding to roughly 72 seconds. It places the event at about 11:16 pm EDT on 15 August 1977 in channel 2, near 1420.4556 MHz. It reports that the telescope had not been pointed at that declination before the run, and that the signal was not seen again in about 30 days at the same declination. This establishes the detection's recorded properties. It does not establish where the signal came from.
Source record s1bigear.org
A VLA search for a steady source
Gray and Marvel searched the region with the Very Large Array, with a sensitivity greater than 100 times the original observations. They found two continuum sources inside the error boxes and no narrowband point source at 1420 MHz above about 20 mJy at the nominal coordinates. They note that a hydrogen line is usually spread over about 100 kHz, rather than confined to adjacent 10 kHz channels. This supports the conclusion that no steady narrowband source was found. It does not show that an intermittent source is absent, because each field was observed for minutes at most.
Source record s2bigear.org
A natural hypothesis from later data
Méndez, Ortiz Ceballos and Zuluaga analysed Arecibo drift scans at 1420 MHz from February to May 2020. They report narrowband signals about 10 kHz wide, roughly two orders of magnitude weaker than the Wow! signal, at several locations associated with cold interstellar hydrogen clouds. They hypothesise that a magnetar flare or soft gamma repeater brightened the hydrogen in such a cloud through maser or superradiance emission, and they say this fits the observed properties. This establishes a natural candidate. It does not show that the 1977 event had this cause.
Source record s3arxiv.org
A check on one candidate star
A 29 September 2022 release from the SETI Institute describes a coordinated observation on 21 May 2022, with the Green Bank and Allen telescopes, of a candidate star, 2MASS 19281982-2640123, proposed as a target by Caballero. The two telescopes observed it simultaneously for 9 minutes and 40 seconds and did not detect a technosignature candidate. The release notes that many other stars could have produced the signal. This establishes what that one observation covered. It does not test the rest of the sky.
Source record s4seti.org
03 · Your reasoning
Follow the strongest explanation.
Choose an interpretation, then compare it with the evidence. You can revise your choice. The goal is understanding, not a perfect score.
04 · The findings
The chain behind the outcome.
Your notebook
Case report
Next in science & discovery: The flare nobody measured
The 1977 event is best described as a single, strong, narrowband detection that was never confirmed. Ehman's record gives its signal-to-noise value and duration and states that the telescope did not see it again over about 30 days at the same declination. Gray and Marvel's VLA search, with much higher sensitivity, found no steady narrowband source at the nominal coordinates, but its short observations cannot exclude a source that flares now and then. The 2022 Breakthrough Listen observation tested one candidate star for under 10 minutes and found no technosignature candidate, so it neither confirmed nor excluded that star. The 2024 Arecibo preprint offers a natural explanation: a magnetar-triggered brightening of hydrogen in a cold cloud, which its authors say fits the observed properties, using their own 2020 detections of weaker signals. That is a hypothesis for the 1977 event, not a finding about it. The honest conclusion is that a natural maser-like source is a plausible explanation consistent with the record, while instrumental and artificial explanations are weakened by the archive’s own checks on aircraft, satellites and transmitters but not fully excluded.
Contributing causes and conditions
- A narrow signal recorded once, in one channel of the computer output
- A signal far above the noise, lasting about 72 seconds within the telescope's beam
- No repeat in about 30 days at the same declination, which limits only steady or regular sources
- A frequency near the hydrogen line, which the 2024 preprint proposes cold hydrogen clouds could produce through maser-like brightening (a hypothesis, not an established cause)
- Later searches with different times and sensitivities; the VLA looked at the nominal position for only minutes per field, too briefly to test an intermittent source
- Interference or instrument faults, which the archive’s checks make less likely but cannot fully exclude
OutcomeWow! signal (1977)
Take the method with you
- A single unrepeated observation can rule out some explanations but rarely identifies a cause, so state what it cannot support.
- Before reading a null result as evidence against a source, check whether the later search could have detected the original event at all.
- A plausible natural mechanism is still a hypothesis until a test ties it to the specific event.
You can read findings at any time. Exploring every reasoning step marks this case as complete in your notebook.
The open record
Sources & further reading
Read the original record and its scope before relying on a conclusion. Source references support the exhibit summaries; Faultory’s reasoning prompts are editorial reconstructions.
- s1
- s2
- s3
- s4
Written and curated for Faultory by Yunus Emre Vurgun, with AI-assisted research and drafting. Sources and interpretations can need correction. Read our editorial standards or report an issue.
Keep investigating