Your browser cannot save progress right now. You can still investigate; keep this tab open or enable local storage to save.
This case has been updated. Compatible choices are kept; revisit the evidence before drawing your conclusion.
01 · The briefing
Begin with the question.
The cosmic microwave background is the afterglow of the early universe, and its light carries a faint polarization, a preferred orientation in the way its waves vibrate. Polarization patterns come in two types. The B-mode pattern is the one that theory links to primordial gravitational waves produced by cosmic inflation, although gravitational lensing by intervening matter can also produce B-modes.
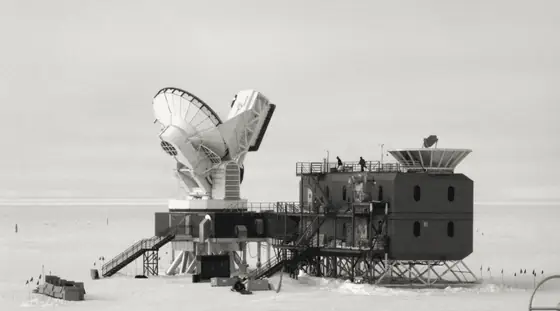
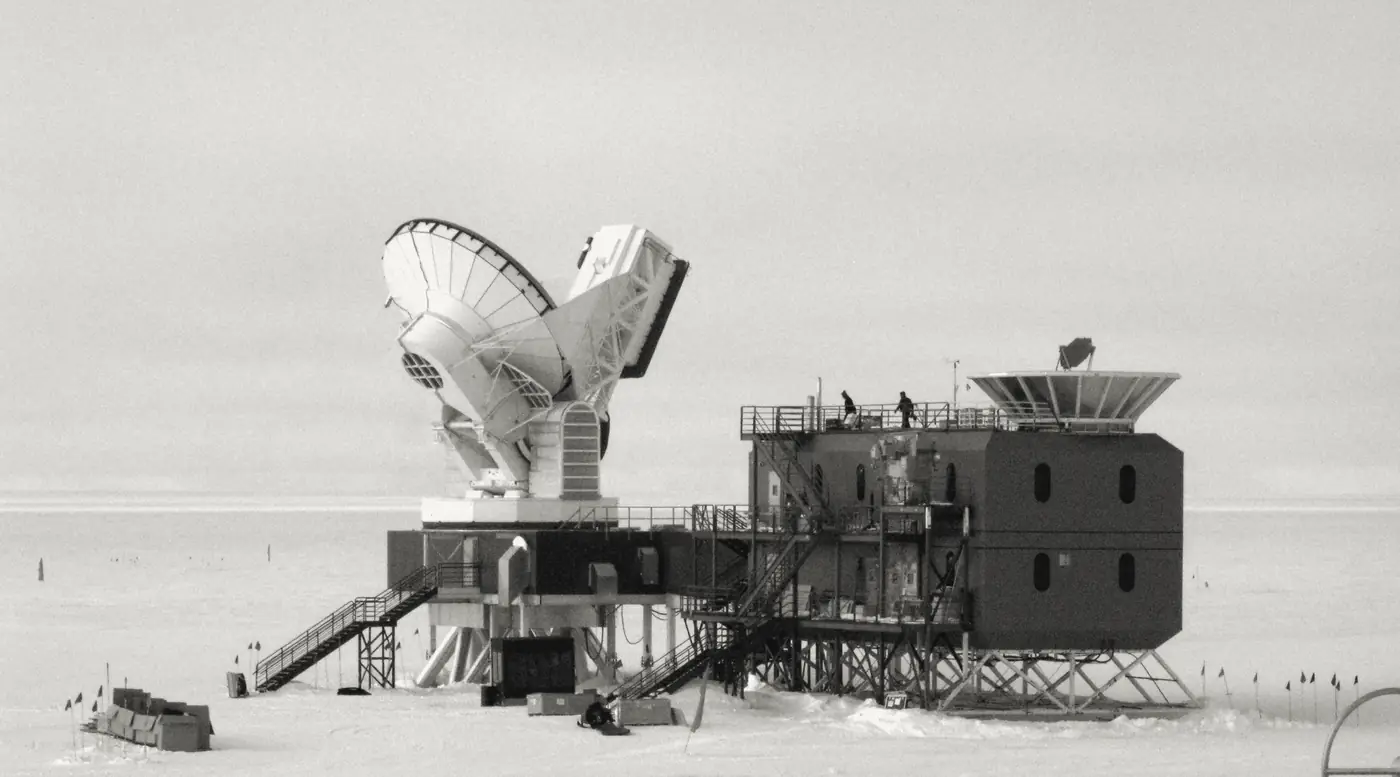
In March 2014 the BICEP2 team, observing from the Amundsen-Scott South Pole Station, reported a B-mode excess at degree angular scales. The team's model gave a tensor-to-scalar ratio r of 0.20, with the no-tensor case disfavored at a stated 7.0 sigma. The result rested on one experiment, so other data sets were the obvious check. The BBC reported that the discovery had been hailed as a near-certain route to a Nobel Prize. Within months, critics pointed out that polarized emission from dust in the Milky Way can mimic the same pattern.
Three explanations were therefore in play: primordial gravitational waves, polarized galactic dust, or an instrumental artifact. This investigation asks which of them the later evidence supports, and how much of the 2014 signal the data can actually attribute to inflation.

The timeline
The BICEP2 team announces a detection of B-mode polarization at degree scales, with r = 0.20 and r = 0 disfavored at 7.0 sigma in its model.
The BICEP2 paper is formally published in Physical Review Letters.
The BBC reports that the team's confidence has been lowered as critics focus on whether dust could account for the signal.
The BICEP2 paper appears in a revised arXiv version that still reports r = 0.20 and the 7.0 sigma figure, while critics continue to test dust as the explanation.
The Planck collaboration posts an analysis of polarized dust emission that, extrapolated to the BICEP2 frequency, gives a dust power of the same magnitude as the BICEP2 excess.
The BICEP2/Keck and Planck collaborations post a joint analysis that finds strong evidence for dust and no statistically significant evidence for tensor modes.
A researched reconstruction for learning. These reasoning steps simplify a complex record; no score can capture the full history.
02 · The evidence
What does the record show?
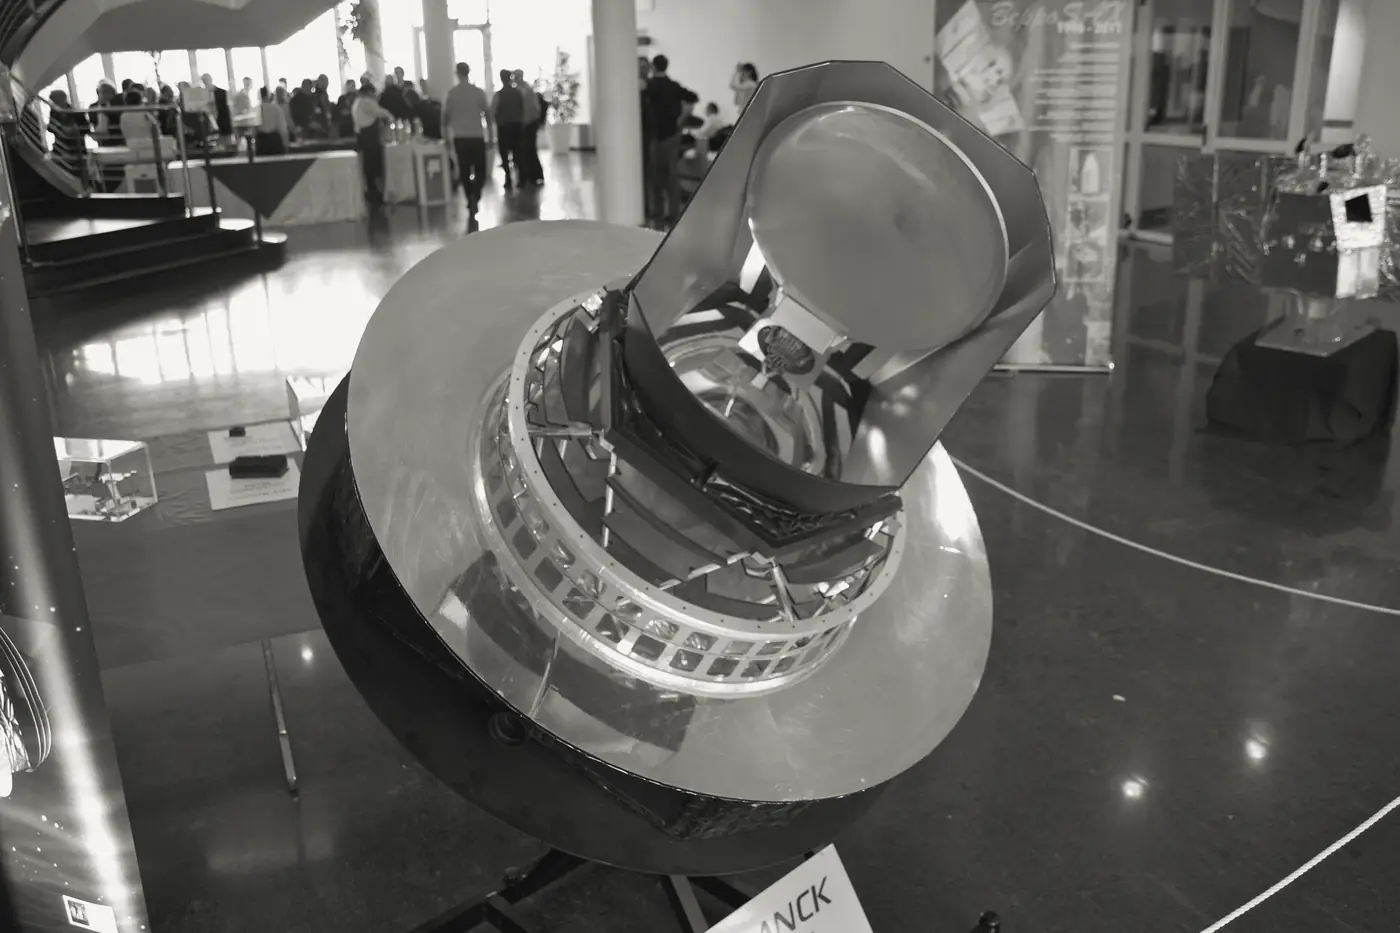
Read each exhibit before settling on an explanation. The source links below every exhibit lead to the record behind it.
Exhibits reviewed 0 of 5
The BICEP2 fit and its significance
The BICEP2 paper reports a fitted tensor-to-scalar ratio of r = 0.20, with r = 0 disfavored at 7.0 sigma under its lensed-LCDM plus tensor model. In the same abstract the authors state that accounting for foreground dust will shift this value downward. The paper establishes the observed B-mode excess and its significance within that model. It does not establish that the excess is primordial, because the fitted value depends on how dust is treated.
Source record s1arxiv.org
The team's own limit on dust models
The BICEP2 paper examines available models of polarized dust and finds that, at their default parameter values, they predict power about 5 to 10 times smaller than the observed excess. The authors add that these models are not sufficiently constrained by external public data to exclude dust emission bright enough to explain the whole excess. The same abstract reports that a cross-correlation with BICEP1 data at 100 GHz disfavours dust at 1.7 sigma, a weaker test. The passage establishes that dust was not excluded by the team's own comparison. It does not establish that dust is bright enough, which is the question the later analyses address.
Source record s1arxiv.org
Planck's dust level in the same field
The Planck paper extrapolates its 353 GHz polarized dust data to 150 GHz and gives a dust power of 1.32 times 10 to the minus two microkelvin squared over the multipole range 40 to 120, with a statistical uncertainty of 0.29 and an extrapolation uncertainty of +0.28 and -0.24 in the same units. The authors state that this level is the same magnitude as the BICEP2 signal over that range. The paper establishes a dust level in the targeted field by extrapolation. It does not measure dust directly at the BICEP2 frequency.
Source record s2arxiv.org
The joint analysis of BICEP2, Keck and Planck
The 2015 joint analysis reports that the data give strong evidence for dust and no statistically significant evidence for tensor modes. It gives an upper limit of r_0.05 below 0.12 at 95 percent confidence, and it reports lensing B-modes detected at 7.0 sigma after marginalizing over dust and r. The paper establishes the revised constraint. The r limit depends on the dust model and its frequency prior, and it is not a measurement of zero primordial signal.
Source record s3arxiv.org
A news account of the criticism
A BBC News report from June 2014, titled Cosmic inflation: Confidence lowered for Big Bang signal, says the critiques since March had focused on whether polarized dust could mimic the pattern, and quotes a team member saying his confidence had gone down. It records the public mood and the timeline of criticism. It is a secondary account of the scientific debate and does not establish the physics.
Source record s4bbc.com
03 · Your reasoning
Follow the strongest explanation.
Choose an interpretation, then compare it with the evidence. You can revise your choice. The goal is understanding, not a perfect score.
04 · The findings
The chain behind the outcome.
Your notebook
Case report
Next in science & discovery: The missing pregnancy data
The BICEP2 team reported in March 2014 a B-mode polarization excess at degree scales, fitted with a tensor-to-scalar ratio of 0.20 and a 7.0 sigma rejection of r = 0 within its model. That is a measurement of the observed excess. Its interpretation depended on how much of the excess was foreground dust, and the team's own paper said that the dust models it examined predicted power about five to ten times smaller than the excess while not being constrained well enough to exclude dust that could explain all of it.
Planck's analysis of polarized dust, posted to arXiv in September 2014, extrapolated to the BICEP2 frequency and gave a dust power of the same magnitude as the BICEP2 signal, with a sizeable extrapolation uncertainty. The 2015 joint analysis of BICEP2/Keck and Planck data then found strong evidence for dust and no statistically significant evidence for tensor modes, with an upper limit on r below 0.12 at 95 percent confidence.
The best-supported reading is therefore that the 2014 excess was substantially contaminated by, and may have been dominated by, polarized galactic dust, and that the data did not establish primordial gravitational waves. The revision happened in public, through independent analysis of the same data and a joint analysis that adopted the critics' central point.
Contributing causes and conditions
- Primordial gravitational waves, if present, would leave a B-mode pattern at degree scales in the polarization of the cosmic microwave background.
- Foreground dust in the Milky Way emits polarized light that can mimic a B-mode pattern at similar angular scales.
- Dust brightness depends on frequency in a way that differs from the primordial signal, so measurements at several frequencies can separate them.
- The 2014 fit assumed a dust model whose brightness was not constrained well enough by external data to rule out a dust-dominated excess.
- The 2015 joint analysis combined BICEP2/Keck and Planck data with a prior on dust's frequency behaviour from Planck's analysis of other sky regions, and found strong evidence for dust and no statistically significant evidence for tensor modes.
OutcomeBICEP2 gravitational wave claim (2014)
Take the method with you
- A headline significance figure depends on the model behind it, so ask which components were marginalized or fixed.
- A critic's alternative should make a different prediction, ideally at another frequency, rather than only a different story.
- A revised limit from a joint analysis is real progress, even when it reverses an earlier headline.
You can read findings at any time. Exploring every reasoning step marks this case as complete in your notebook.
The open record
Sources & further reading
Read the original record and its scope before relying on a conclusion. Source references support the exhibit summaries; Faultory’s reasoning prompts are editorial reconstructions.
- s1
- s2
- s3
- s4
Written and curated for Faultory by Yunus Emre Vurgun, with AI-assisted research and drafting. Sources and interpretations can need correction. Read our editorial standards or report an issue.
Keep investigating