Your browser cannot save progress right now. You can still investigate; keep this tab open or enable local storage to save.
This case has been updated. Compatible choices are kept; revisit the evidence before drawing your conclusion.
01 · The briefing
Begin with the question.
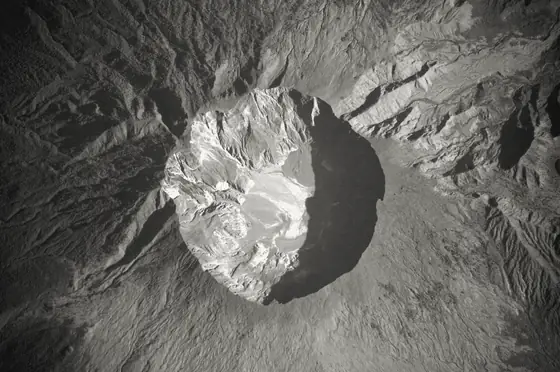
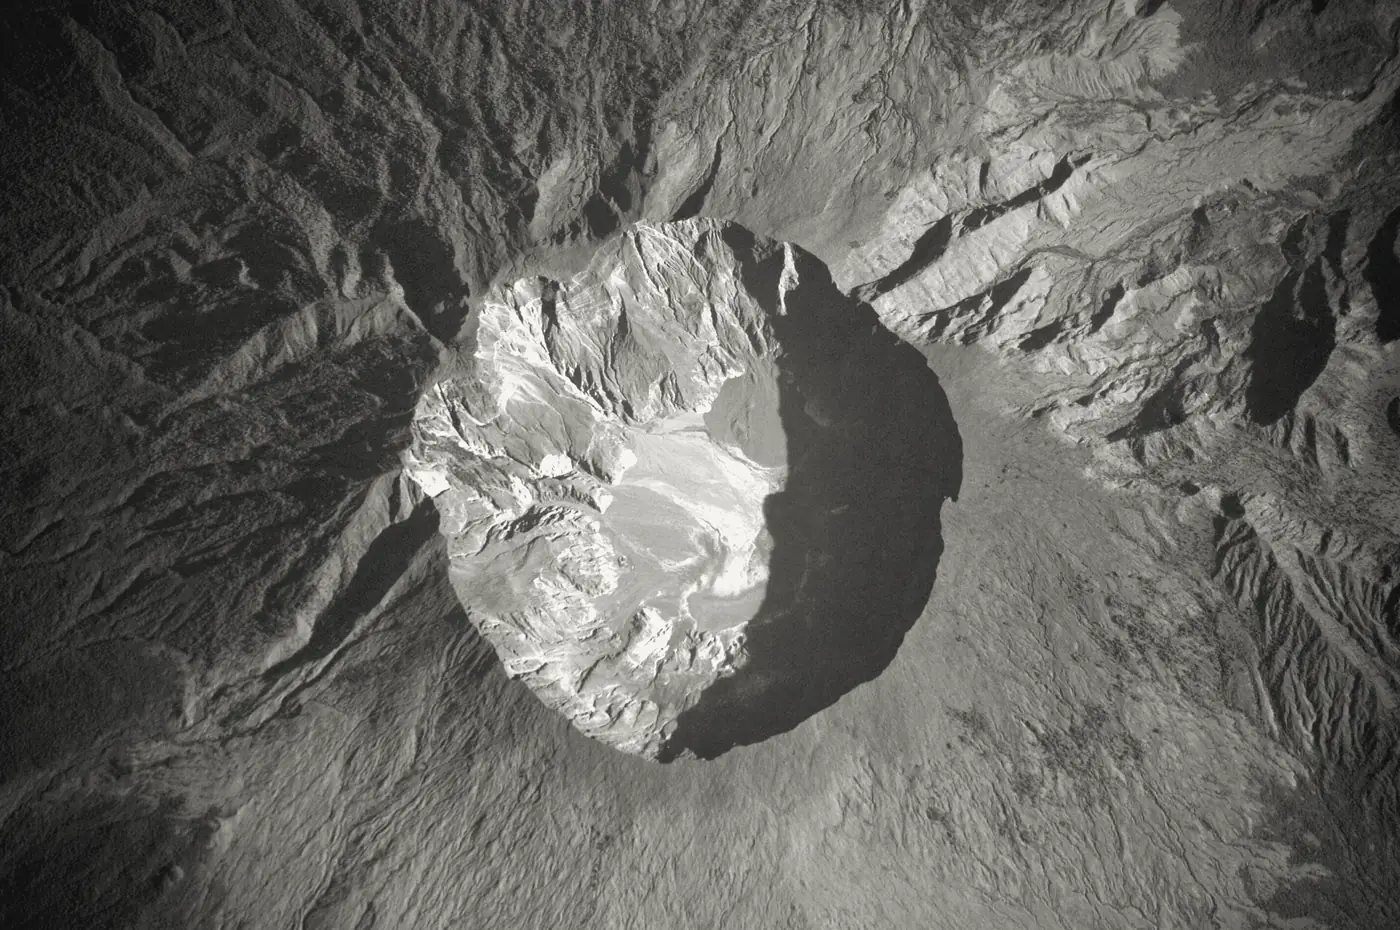
In April 1815, Mount Tambora on Sumbawa island, in present-day Indonesia, erupted in what NASA describes as the largest eruption in recorded history. Ash and gases reached the upper atmosphere, and the following year became known as a 'year without a summer'. In New England it was remembered for six inches of June snow, frost in every month and lost crops. The connection is attractive: one geophysical event seems to explain a widespread disruption.
Three explanations compete in popular accounts. The first treats Tambora as the sole cause of the cold. The second attributes the cold to ordinary natural variability, the normal swing of summer weather. The third treats the hardship as mainly a failure of farming, markets and trade. This investigation asks what physically links the eruption to the climate, what kinds of evidence support that link, and how far any single cold summer can be attributed to one volcano. The answer depends on separating a physical mechanism from particular weather events, and on distinguishing measured temperatures from crop failures, which had many contributors.

The timeline
Tambora is active, according to NASA's account of the volcano's history before the main eruption.
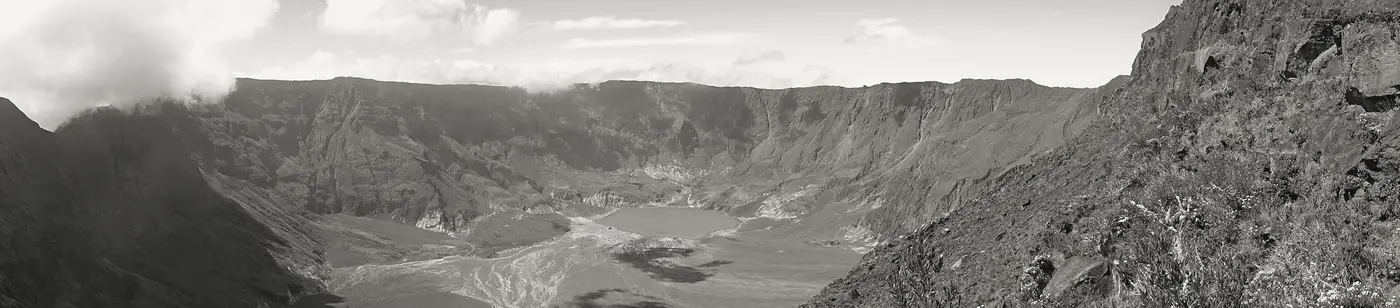
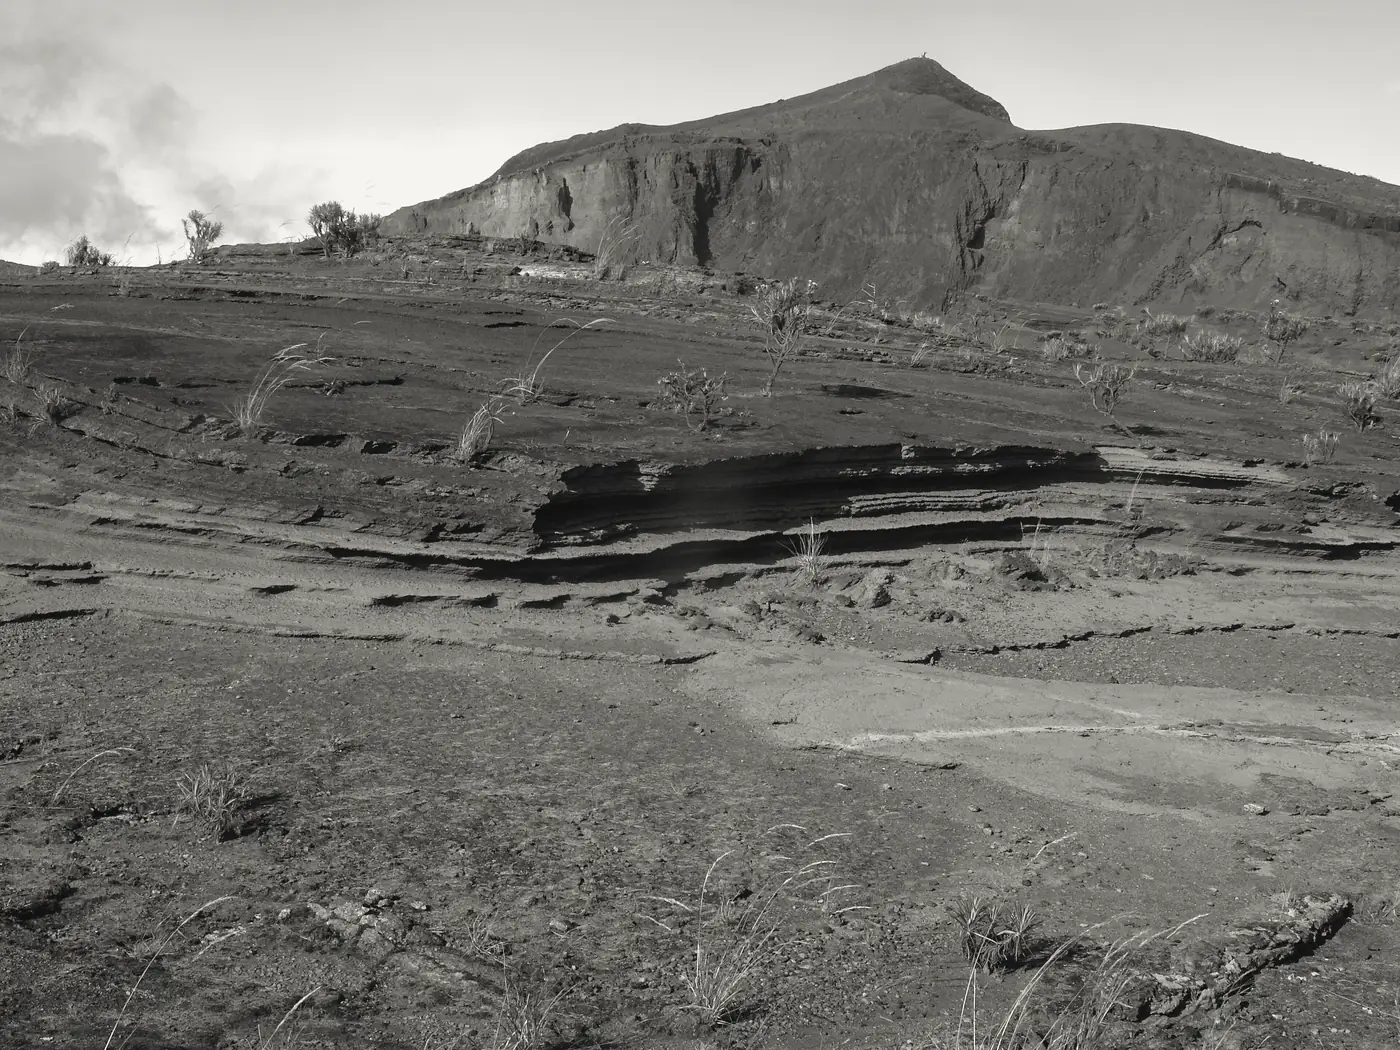
The major eruption; NASA estimates about 150 cubic kilometres of tephra, with ash recognised at least 1,300 kilometres away.
The central England summer mean is about 13.4 degrees Celsius, third-coldest of the 368 summers from 1659 to 2026, by Faultory's ranking of the Met Office monthly means.
New England records a 'year without a summer', with six inches of snow in June and hard frost in every month, according to the New England Historical Society.
Sigl and colleagues publish in Nature a study of the timing and climate forcing of volcanic eruptions over the past 2,500 years.
A researched reconstruction for learning. These reasoning steps simplify a complex record; no score can capture the full history.
02 · The evidence
What does the record show?
Read each exhibit before settling on an explanation. The source links below every exhibit lead to the record behind it.
Exhibits reviewed 0 of 5
A plume that reached the upper atmosphere
NASA's Earth Observatory describes the 10 April 1815 eruption as producing an estimated 150 cubic kilometres of tephra, with ash recognised at least 1,300 kilometres away, and states that enough ash entered the atmosphere to reduce sunlight and cause global cooling, leading to the 1816 'year without a summer'. The account describes the mechanism in terms of ash. It does not measure 1816 temperatures.
Source record s1science.nasa.gov
Ice cores and tree rings
The Nature study by Sigl and colleagues resolves inconsistencies between the timing of volcanic aerosol loading recorded in ice cores and the cooling recorded by tree rings. The authors conclude that large tropical and high-latitude eruptions were primary drivers of Northern Hemisphere temperature variability over the past 2,500 years. Its extended data includes a subset of eruptions with sulfate loadings larger than Tambora 1815's.
Source record s2nature.com
A weather record for central England
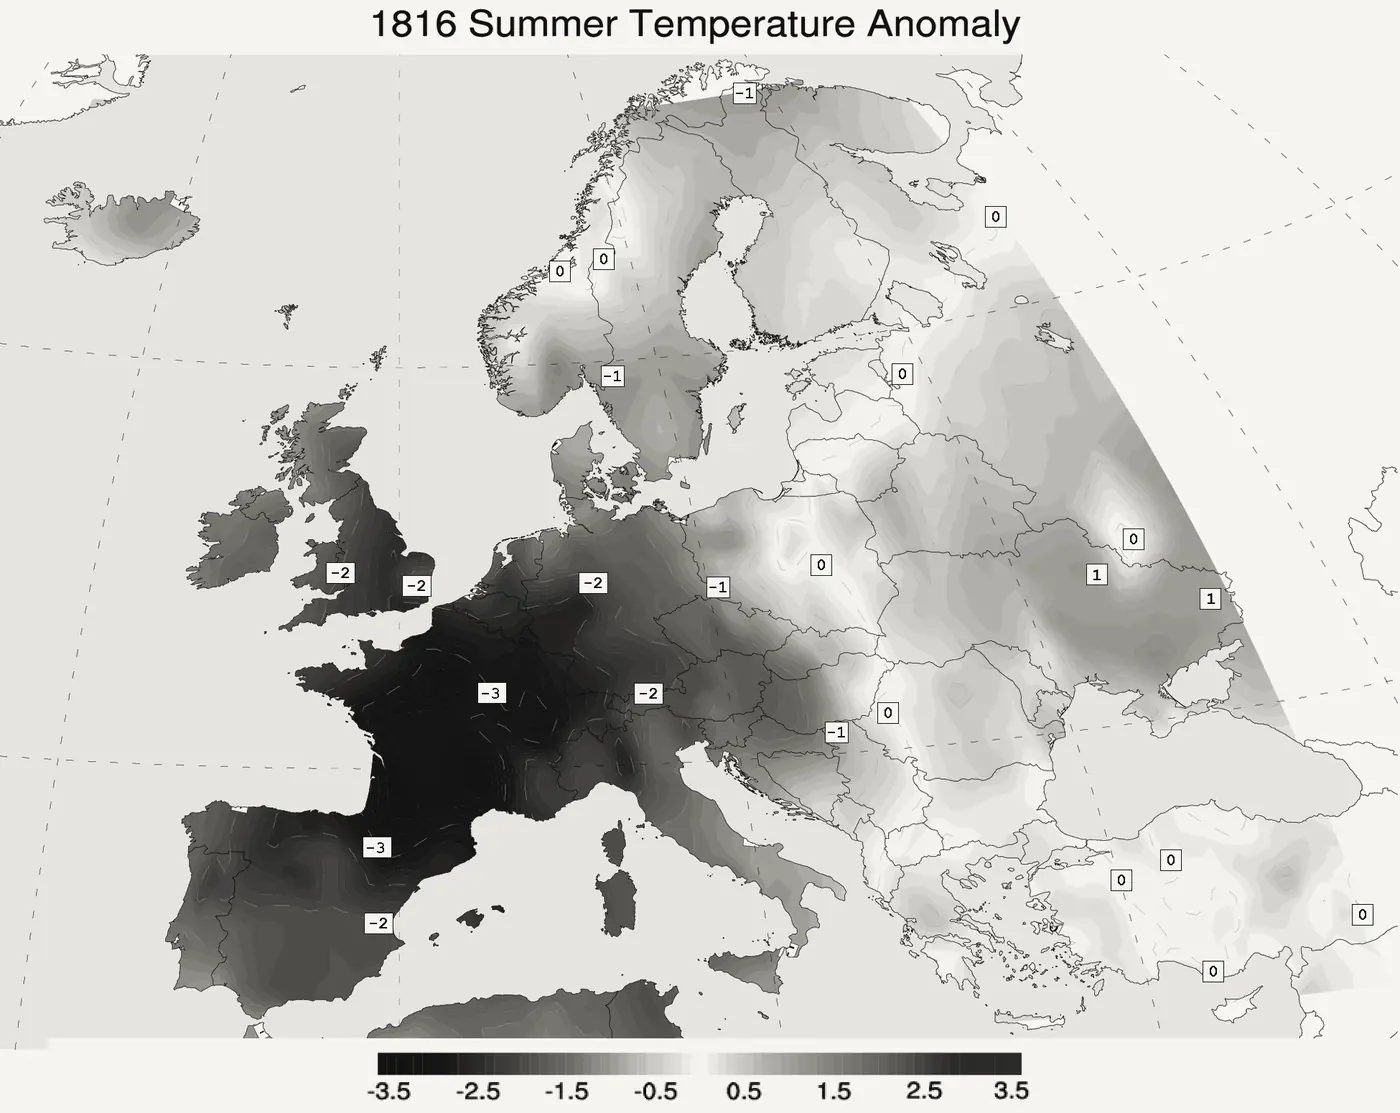
The Met Office Central England Temperature series gives monthly means from 1659. The June-August mean for 1816 is about 13.4 degrees Celsius, against about 14.8 for 1815 and 14.3 for 1817. Ranking the published monthly means (Faultory's own calculation) places the 1816 summer third-coldest of the 368 summers from 1659 to 2026. This is a single region, and it shows a cold summer, not its cause.
Source record s3metoffice.gov.uk
Crop failures in New England
The New England Historical Society describes six inches of snow in June, hard frost in every month, and July and August temperatures as low as 40 degrees Fahrenheit as far south as Connecticut. It reports destroyed bean crops, hay shortages that forced livestock slaughter, hoarding and price rises. This is a secondary summary. It shows consequences of a cold year, which had several contributors.
Source record s4newenglandhistoricalsociety.com
Testing one eruption against many
The Nature study uses a superposed-epoch analysis across sets of large eruptions, including the 28 largest, the 23 largest tropical eruptions and those larger than Tambora, measuring tree-ring growth 15 years after sulfate deposition. This tests whether large eruptions are followed by cooling as a set. A single summer such as 1816 cannot be tested that way on its own.
Source record s2nature.com
03 · Your reasoning
Follow the strongest explanation.
Choose an interpretation, then compare it with the evidence. You can revise your choice. The goal is understanding, not a perfect score.
04 · The findings
The chain behind the outcome.
Your notebook
Case report
Next in history & systems: Lead, scurvy and a long winter
The sources support a chain of reasoning. A very large eruption in April 1815 injected material into the upper atmosphere, and the cold that followed in 1816 is attributed to that material reducing sunlight. NASA's account makes this link in terms of ash. The Nature study, which compares ice-core timing with tree-ring cooling, supports the broader claim that large eruptions drive Northern Hemisphere temperature variation, and its extended data uses Tambora 1815 as a reference size for a subset of large eruptions.
The weather record shows the 1816 summer as exceptionally cold in central England. The June-August mean of about 13.4 degrees Celsius is among the three lowest in a series that starts in 1659. The New England account describes frost in every month, snow in June and crop losses, with hoarding and price rises. These are consistent with a cold year, though they are not measurements of the eruption.
The reconstruction should separate three levels. The eruption and the stratospheric aerosol are physically well supported in outline. The association between large eruptions and cooling is supported statistically across events. The claim that Tambora caused a particular cold summer or particular crop failures is an attribution that one region and one year cannot prove, because weather varies and economies respond to shortages in their own ways.
Contributing causes and conditions
- A very large eruption on 10 April 1815 injected ash and gases high into the atmosphere.
- Material spread in the stratosphere reduced the sunlight reaching the surface.
- The cooling persisted through the 1816 growing season, bringing frost and crop losses in several regions.
- Local weather variability and food markets shaped how severe the outcomes were in each place.
- The link to one eruption is strongest in the pattern across many events, not in any single summer.
OutcomeMount Tambora eruption (1815)
Take the method with you
- A physical mechanism can be well supported while an attribution to one specific event remains uncertain.
- Test an event against a set of comparable events rather than a single memorable case.
- Separate a measured weather anomaly from its social consequences, which have many causes.
You can read findings at any time. Exploring every reasoning step marks this case as complete in your notebook.
The open record
Sources & further reading
Read the original record and its scope before relying on a conclusion. Source references support the exhibit summaries; Faultory’s reasoning prompts are editorial reconstructions.
- s1
- s2
- s3Met Office Hadley Centre - HadCET Central England Temperature data download
www.metoffice.gov.uk
- s4New England Historical Society - 1816: The Year Without a Summer
www.newenglandhistoricalsociety.com
Written and curated for Faultory by Yunus Emre Vurgun, with AI-assisted research and drafting. Sources and interpretations can need correction. Read our editorial standards or report an issue.
Keep investigating