Your browser cannot save progress right now. You can still investigate; keep this tab open or enable local storage to save.
This case has been updated. Compatible choices are kept; revisit the evidence before drawing your conclusion.
01 · The briefing
Begin with the question.
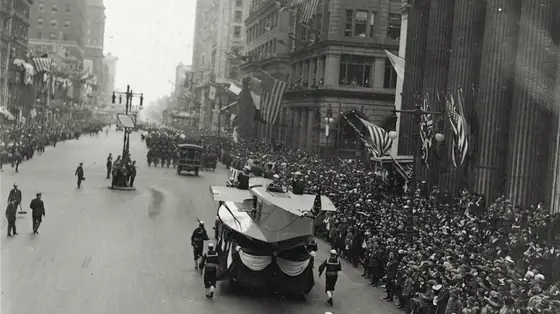
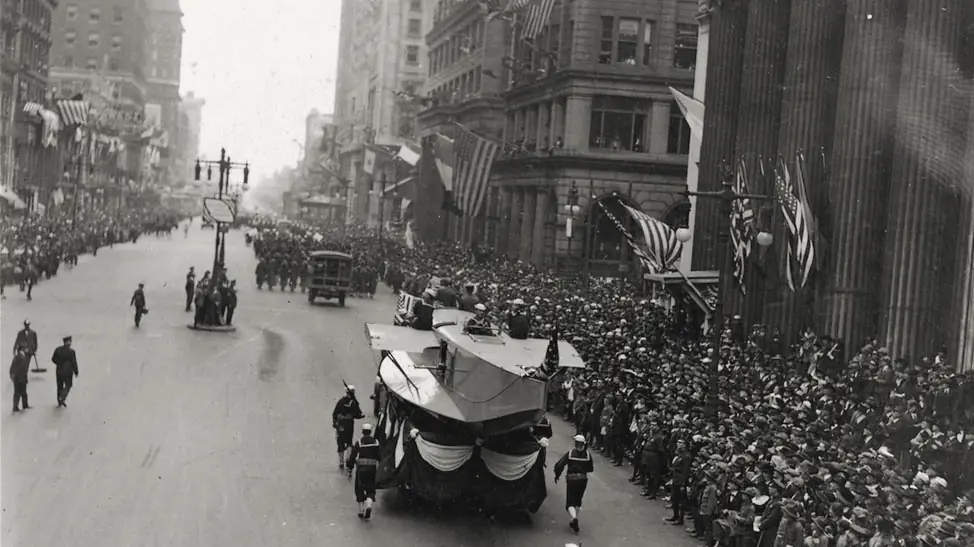
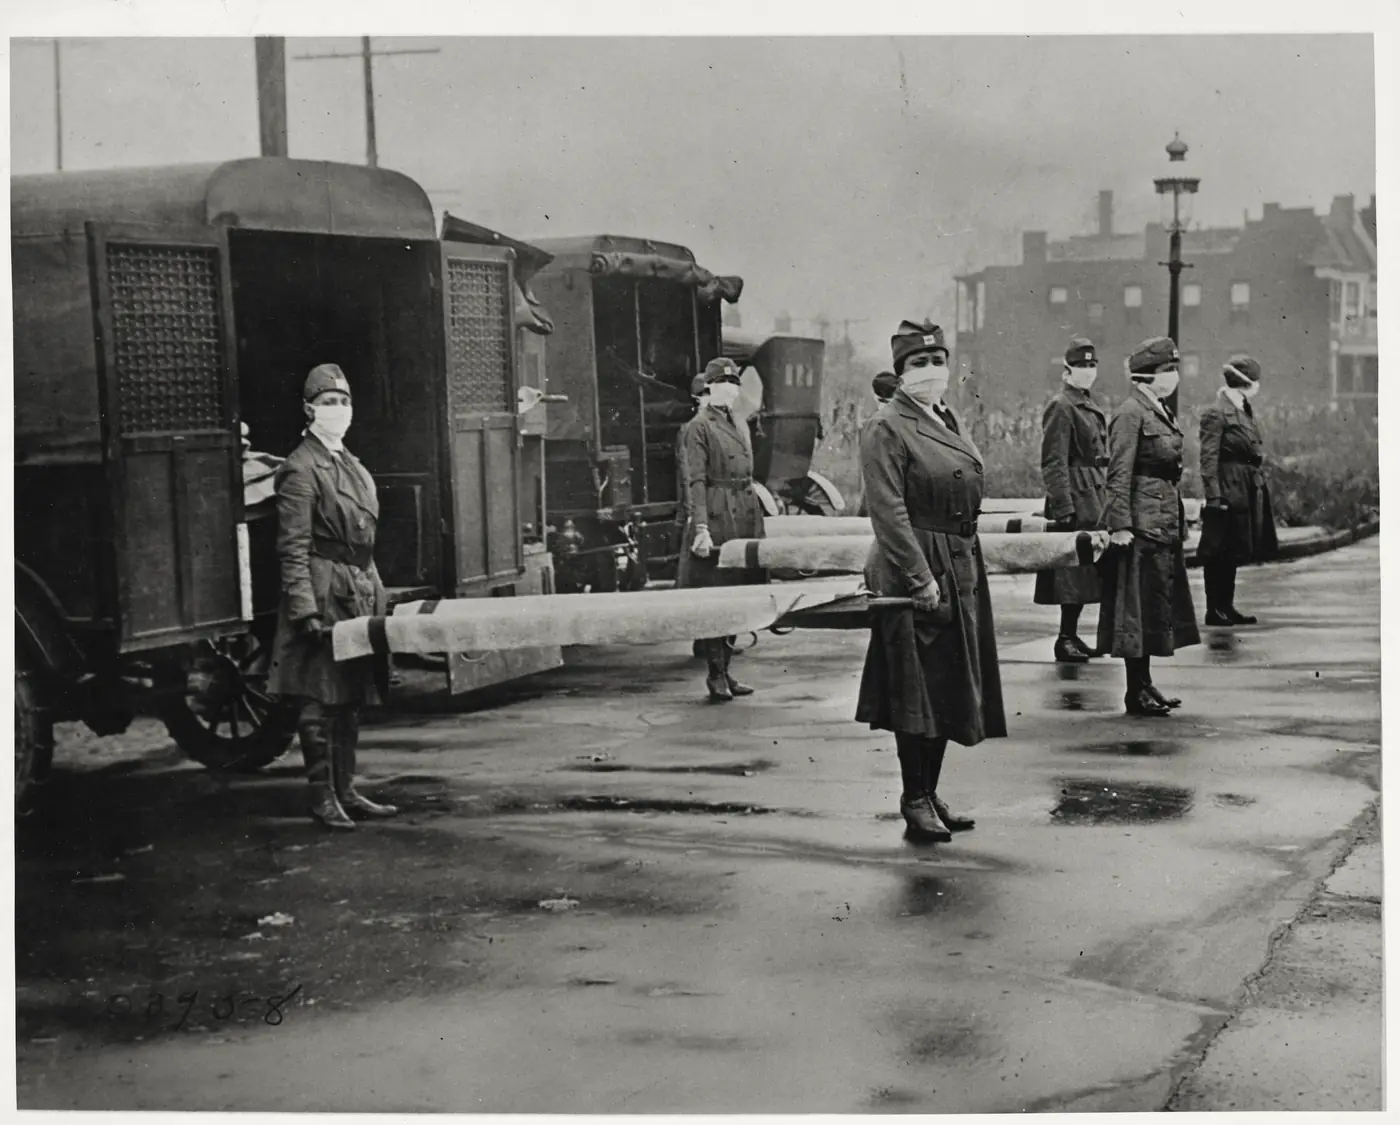
In September and October 1918, influenza spread through American cities that were already crowded with wartime activity. Health officials had to decide, often under pressure, whether to close schools, churches and theatres and whether to cancel public gatherings. Two cities provide a sharp contrast. Philadelphia recorded its first civilian cases in mid-September and allowed a large Liberty Loan parade on 28 September to go ahead. St. Louis reported its first civilian cases on 5 October and introduced a broad set of social-distancing measures two days later. Philadelphia's epidemic was far larger.
Several explanations are easy to offer. One holds that the parade alone caused the deaths, a claim too simple for a pandemic that was already spreading. Another holds that the cities differed in population, age structure or in the virus itself. A third holds that the measures made no difference, because the epidemic would have run its course anyway. This investigation separates what the comparison shows about timing from what it cannot show about cause. The evidence is historical and depends on reported cases and deaths. Keep the difference between a documented sequence and a demonstrated mechanism in view.
The timeline
Philadelphia reports its first civilian cases of influenza.
Influenza reaches the Philadelphia Navy Yard, and within days about 600 sailors fall ill.
Philadelphia's Fourth Liberty Loan parade draws about 200,000 people to the streets.
Philadelphia introduces school closures and bans on public gatherings.
St. Louis reports its first civilian cases.
St. Louis implements a broad set of social-distancing measures.
Hatchett and colleagues in PNAS, and Markel and colleagues in JAMA, publish analyses of 1918 interventions across cities.
A researched reconstruction for learning. These reasoning steps simplify a complex record; no score can capture the full history.
02 · The evidence
What does the record show?
Read each exhibit before settling on an explanation. The source links below every exhibit lead to the record behind it.
Exhibits reviewed 0 of 5
Timing in Philadelphia
The PNAS study records that the first civilian cases in Philadelphia were reported on 17 September 1918. Authorities downplayed their significance and allowed large public gatherings, including the 28 September parade, to continue. School closures and bans on gatherings began on 3 October, when disease had already begun to overwhelm local medical services. The timing is documented. The parade's share of infections is not.
Source record s1pmc.ncbi.nlm.nih.gov
Timing in St. Louis
The same study reports that St. Louis's first civilian cases were reported on 5 October, and that measures followed on 7 October. The authors describe the response-time gap, about 14 days when measured from the first reported cases, as roughly three to five doubling times of an influenza epidemic. It is a comparison of two cities, not a controlled experiment.
Source record s1pmc.ncbi.nlm.nih.gov
Peak and cumulative death rates
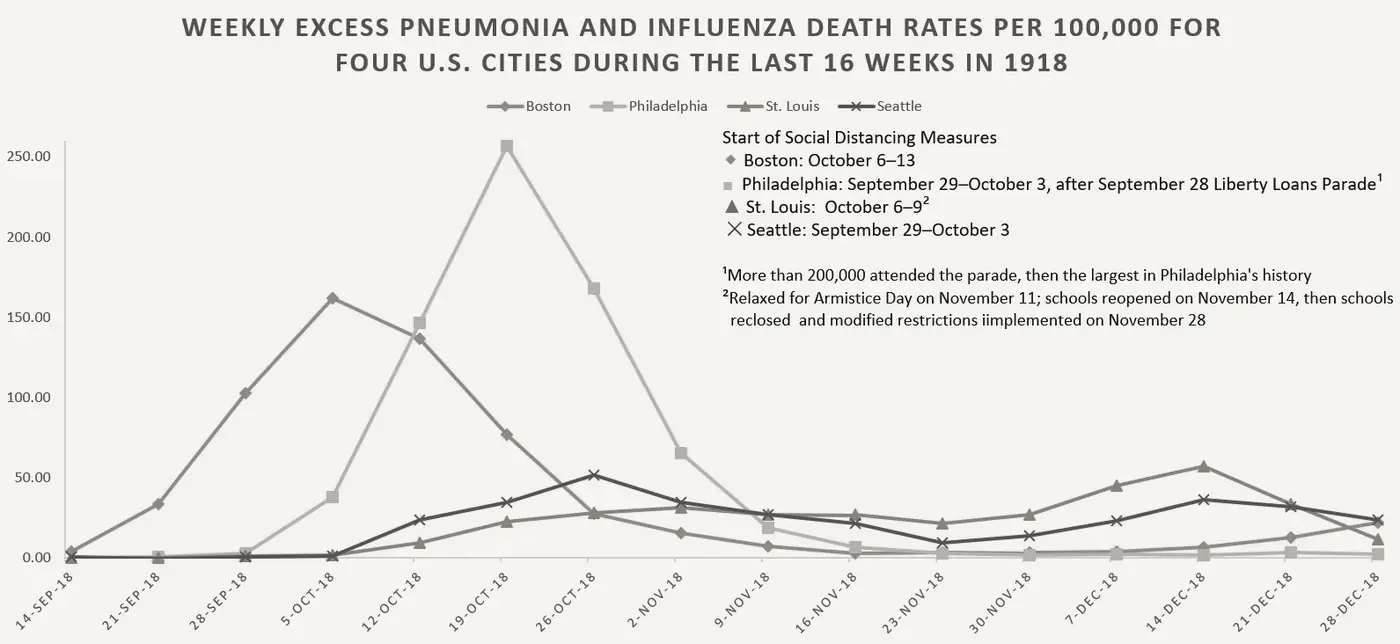
The PNAS paper reports a peak weekly pneumonia and influenza death rate of 257 per 100,000 in Philadelphia, against 31 per 100,000 in St. Louis while its measures were in place. Cumulative excess rates were 719 and 347 per 100,000. The authors note that the measures appear to matter more for the peak than for the cumulative total. These are outcome data, but they do not isolate any single measure.
Source record s2pubmed.ncbi.nlm.nih.gov
Forty-three cities
Markel and colleagues examined nonpharmaceutical interventions in 43 continental US cities from 8 September 1918 to 22 February 1919, covering 115,340 excess pneumonia and influenza deaths. Cities that acted earlier had longer delays to peak mortality and lower peak mortality. School closures combined with gathering bans were the most common combination, and were significantly associated with reductions in weekly excess deaths. The design is observational.
Source record s3pubmed.ncbi.nlm.nih.gov
The parade in its setting
The University of Pennsylvania Archives notes that influenza arrived at the Philadelphia Navy Yard on 19 September, that the Fourth Liberty Loan rally brought 200,000 Philadelphians into the streets nine days later, and that Philadelphia had 635 new cases by 1 October. It summarises the sequence but is an exhibit, not a measurement. The parade is one exposure among many.
Source record s4archives.upenn.edu
03 · Your reasoning
Follow the strongest explanation.
Choose an interpretation, then compare it with the evidence. You can revise your choice. The goal is understanding, not a perfect score.
04 · The findings
The chain behind the outcome.
Your notebook
Case report
Next in history & systems: Drought meets the plough
The timing contrast is the strongest documented pattern. In Philadelphia the first civilian cases were reported on 17 September, the 28 September parade went ahead, and school closures and bans on gatherings began on 3 October, when the epidemic had already begun to overwhelm local services. In St. Louis the first civilian cases were reported on 5 October and measures followed on 7 October. Hatchett and colleagues set this response-time gap, about 14 days measured from first reported cases, against the mortality outcomes: a peak of 257 per 100,000 in Philadelphia and 31 per 100,000 in St. Louis while measures were in place.
The multi-city analysis points in the same direction. Markel and colleagues studied 43 cities and found that cities acting earlier reached peak mortality later and had lower peak mortality. The most common combination, closing schools and banning public gatherings, was used in most cities and was associated with reductions in weekly excess deaths.
The interpretation has limits. The measures were often short, and spread resumed when they were relaxed. No single intervention can be credited on its own, and the comparisons cannot control for everything that differed between cities, such as crowding, age structure and health services. The parade is therefore best treated as one part of a delayed and mixed response rather than as the sole cause of deaths. The supported lesson is that early, sustained and combined measures are associated with lower peaks. The historical record cannot isolate one intervention, and it cannot guarantee the same result in a future pandemic.
Contributing causes and conditions
- Philadelphia's first civilian cases were followed by a large public parade on 28 September, and gathering bans waited until 3 October.
- Philadelphia's first response was limited: cases were downplayed and public gatherings continued until 3 October.
- Measures came about 16 days after first cases in Philadelphia, but two days after first cases in St. Louis.
- Peak and cumulative death rates differed sharply between the two cities.
- Relaxing measures allowed renewed spread, which limits any single-city lesson.
Outcome1918 influenza pandemic
Take the method with you
- A timing difference can be documented even when the cause of an outcome difference is not.
- Compare many cases before attributing a result to one intervention.
- Relaxing a measure can reverse its benefit, so timing and duration both matter.
You can read findings at any time. Exploring every reasoning step marks this case as complete in your notebook.
The open record
Sources & further reading
Read the original record and its scope before relying on a conclusion. Source references support the exhibit summaries; Faultory’s reasoning prompts are editorial reconstructions.
- s1
- s2PubMed - Hatchett, Mecher and Lipsitch, PNAS 2007 (PMID 17416679)
pubmed.ncbi.nlm.nih.gov
- s3
- s4University of Pennsylvania Archives - Penn and the 1918 Influenza Epidemic
archives.upenn.edu
Written and curated for Faultory by Yunus Emre Vurgun, with AI-assisted research and drafting. Sources and interpretations can need correction. Read our editorial standards or report an issue.
From the journal
Field notes that use this case
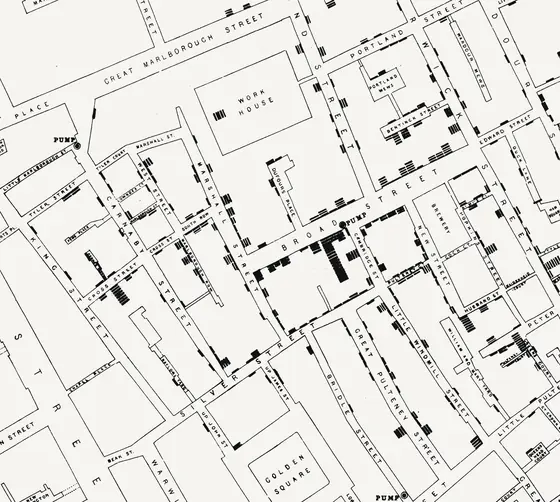 Confounding: why two groups can differ for other reasonsComparing groups can reveal causes or mislead about them. Learn how confounders, natural experiments and seasonal patterns change what a comparison shows.
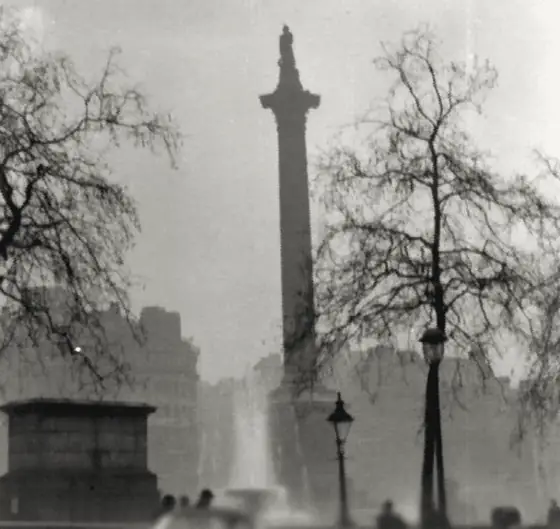 When nature runs the experiment: natural tests of causeWeather, seasons and epidemics sometimes change conditions for us. Learn to read such events as tests, and to see what they cannot prove on their own.
Keep investigating