After reading, you will be able to recognize a natural experiment, identify its comparison groups and possible confounders, and judge whether independent measurements confirm a pattern. The cases are London's smog of 1952, the Antarctic spring ozone record and the 1918 influenza outbreak in American cities.
01An experiment nobody designed
A natural experiment occurs when nature, rather than an investigator, changes conditions for some places or times and not for others. The investigator's task is to find the comparison that nature has provided and to test whether the difference is what the proposed cause predicts. Nature rarely assigns its changes at random, so the comparison needs care.
Such events can be large and realistic. A coal-burning city under an unusual weather pattern, a polar spring and a pandemic that reached towns at different times each supply a contrast a laboratory could not easily reproduce. The risk is that more than one thing changes at once, and the strongest-looking pattern may be produced by a change nobody was studying.
Natural experiments have a practical advantage. The investigator does not need to expose people to a hazard to learn from it, because the hazard has already occurred. The obligation that follows is to learn from it honestly, reporting the comparisons that favor the proposed explanation and the ones that do not.
02A lid of cold air over London
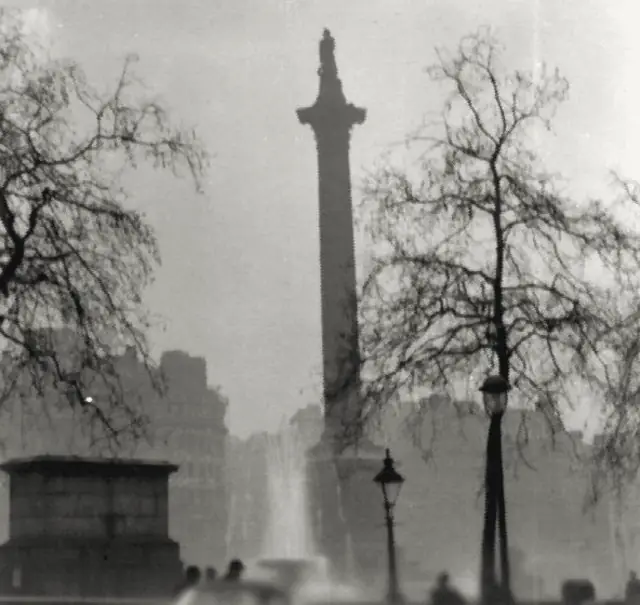
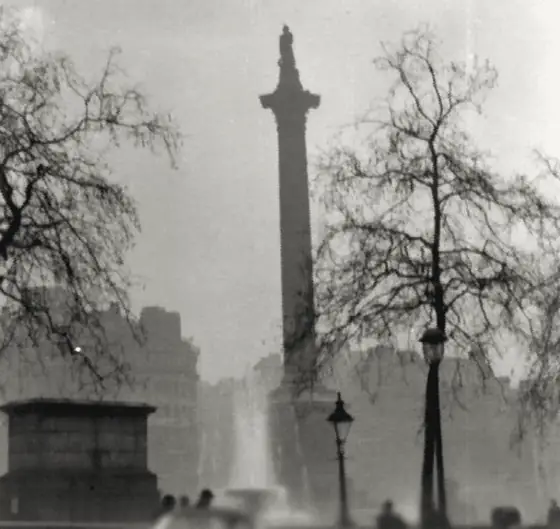
In December 1952 London experienced a smog that was both a visibility problem and a public-health emergency. The Met Office describes the setting: an anticyclone hung over the region, air descended and warmed, and that created a temperature inversion, with cooler air close to the ground beneath warmer air higher up. Smoke from chimneys that would normally rise and disperse was trapped near the surface.
The source was not new. Coal combustion from homes and other sources had been a constant feature of the city, and fog was familiar. What changed was the atmosphere's capacity to mix emissions away. The same flow of smoke into an open, well-mixed atmosphere and into a shallow, trapped layer can produce very different concentrations, so the weather belongs in the explanation alongside the emissions.
The 1956 Clean Air Act addressed the sources as well as the weather. It introduced smoke control areas. The episode ended when the weather changed, but that ending removed the trap without removing the emissions. Prevention required interrupting the source or the trap, and the Act pursued the source.
The case also shows why a single kind of observation can mislead about the scale of a problem. Visibility is what people could see from the street, and it is a poor proxy for the concentration of pollutants in the air they breathed. Measured concentrations can be compared across days and places, which is why the lesson drawn from the episode favors measurement over impression.
03Comparing like with like over Antarctica
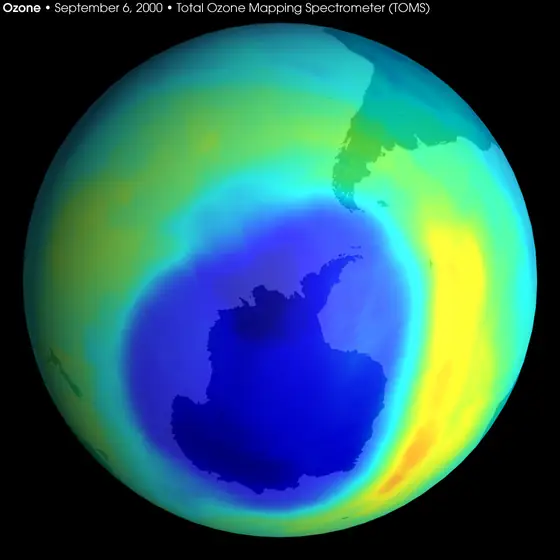
Ozone measurements from the British station at Halley were central to the discovery that springtime ozone over Antarctica was declining. Joseph Farman, Brian Gardiner and Jonathan Shanklin reported large losses of total ozone in a 1985 paper in Nature, which linked the losses to a seasonal interaction between chlorine and nitrogen oxides.
The key comparison was spring against spring. Comparing arbitrary seasons would have confused the ordinary seasonal cycle with a long-term trend. Matching the seasons across years showed a systematic decline in spring values rather than one unusual year. A long baseline, beginning in the late 1950s, supplied the earlier values against which the later declines could be recognized.
Independent satellite observations then showed that the depletion covered a large region, which reduced the chance that one station's instrument was responsible. The mechanism also had to fit the timing. Cold polar conditions allow stratospheric clouds to form, and reactions on their surfaces activate chlorine compounds that destroy ozone rapidly once spring sunlight returns. A mechanism predicting a steady decline throughout the year would have failed the timing test.
04Cities that acted at different times
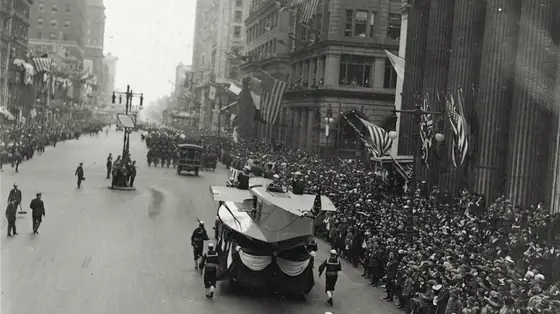
The 1918 influenza pandemic offers a natural experiment of another kind. Many American cities adopted measures such as closures and bans on gatherings at different times, and the pandemic reached each city at its own pace. A 2007 study in the Proceedings of the National Academy of Sciences by Hatchett, Mecher and Lipsitch examined the timing of 19 classes of nonpharmaceutical interventions in 17 US cities.
The reported association was that cities which implemented multiple interventions early had peak death rates about 50 percent lower than cities that did not, and less steep epidemic curves. The study also found a smaller cumulative effect on excess mortality, about 20 percent, which was less statistically significant. The authors note that few cities kept such measures in place for longer than six weeks, which matters for interpreting the result.
The cities differed in size, density, climate, case numbers and local policy, so a comparison across them supports an association rather than a complete causal account. Its strength lies in using variation in timing as a test, and in reporting the less dramatic cumulative result alongside the more dramatic peak result.
Comparisons across cities also require care about timing. The analysis compares the timing of measures in each city with the course of that city's epidemic, rather than assuming that all cities followed the same curve. An association of this kind is most useful when it holds across many comparisons and when the authors state the limits of their data plainly.
05What a natural experiment cannot do
A natural experiment cannot randomize the world. Its comparisons may be confounded by something that changed at the same time, by differences between the places compared, or by the way events were recorded. Even a striking pattern needs independent support: a different measurement, a second location, or a mechanism that predicts the timing as well as the size of the effect.
The three cases show this discipline. The smog was supported by measurements of smoke and by the meteorology that trapped it. The Antarctic ozone record was checked against seasonal baselines and confirmed by satellites. The influenza analysis reported a less dramatic cumulative result alongside its peak result and acknowledged how brief the measures were in practice.
For a reader, the question is always the same. What changed, where and when? What stayed the same? What would the pattern look like if the proposed cause had nothing to do with it?
A useful habit is to write down, before looking at the data, the pattern each explanation predicts. A natural experiment that appears to confirm an explanation after the fact is weaker than one whose predicted pattern was stated in advance and then tested.
Terms in this note
- Natural experiment
- An event that changes conditions in a way the investigator did not design, producing comparison groups that can be studied. Glossary
- Confounder
- A factor that changes along with the exposure being studied and can create or hide an apparent effect. Glossary
- Temperature inversion
- A layer of cooler air beneath warmer air, which suppresses vertical mixing and can trap pollution close to the ground. Glossary
Test the idea
The case files behind this note

The open record
Sources & further reading
- 1The Great Smog of 1952
Met Office
- 2Clean Air Act 1956 (original text)
legislation.gov.uk
- 3The story behind the discovery of the ozone hole
UK Research and Innovation
- 4
- 5
Written for Faultory by Yunus Emre Vurgun, with AI-assisted research and drafting. Editorial standards · Report an issue.