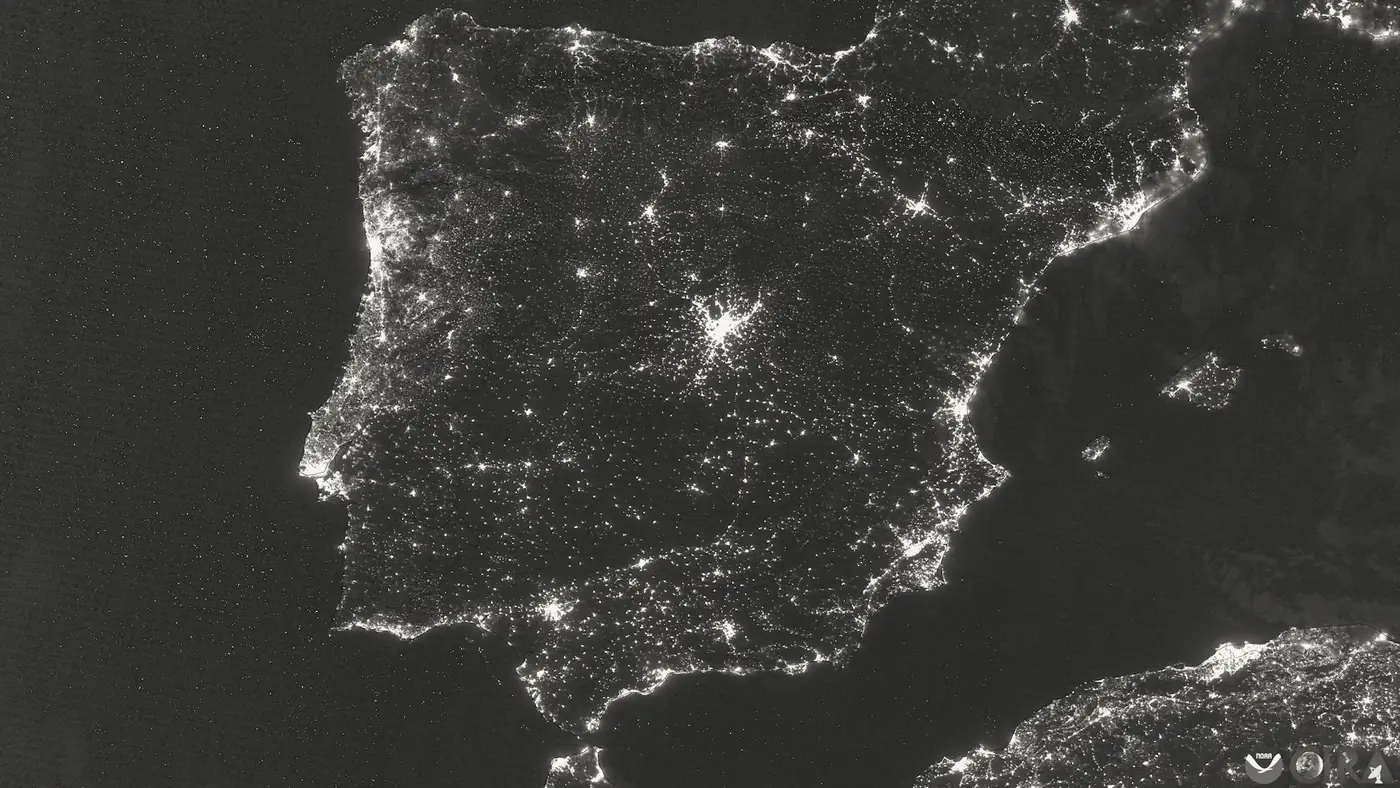
After reading, you will be able to tell which measured signal showed a grid's margin shrinking and which automatic protections acted next. You will also be able to separate the timing of a blackout from the causes that official reviews have established.
01Four explanations, one question
The Iberian case file opens with four explanations for the collapse of 28 April 2025: a sudden loss of a large generator, a fault on the link to France, a failure of voltage control, and an oscillation between parts of the system. Each predicts a different sequence of trips and different voltage readings.
The three cases stress different parts of the system: voltage in Iberia, frequency and supply in Texas, and what operators could see in 2003. An interconnected grid also redistributes power when a line trips, and that redistribution can stress the remaining paths.
Interpretation: the useful first question is which limit was crossed first, and how much room the system had before it was crossed.
02Voltage: a rise the grid could not absorb
The Iberian timeline begins at about 12:32:20 on 28 April 2025, when a steep local voltage rise started at a substation near Granada, according to the final report. Between 12:33:17 and 12:33:18.020, several trips disconnected 928 MW of wind and solar generation, some of them on overvoltage protection.
The Expert Panel's final report, published on 20 March 2026, names the non-effectiveness of voltage control as the key phenomenon. Its simulations indicate that larger reactive power margins could have prevented the collapse. That is a model result, not a measurement of plant behaviour.
The panel also found that overvoltage protection at some generation units was set below the voltage limits in the applicable requirements. It could not establish the cause of most of the overvoltage trips.
Interpretation: the voltage account has two layers, an ineffective control and protection settings out of line with the requirements. The record establishes both, but it does not measure how much of the 928 MW each one explains.
03Frequency: a nine-minute window
In Texas, the February 2021 sequence ran through frequency. The FERC and NERC narrative describes frequency falling as generating units failed. ERCOT ordered its first 1,000 MW of load shed at 1:20 a.m. on 15 February 2021, then another 1,000 MW, with operators having only nine minutes to prevent about 17,000 MW of units tripping on underfrequency relays.
The reviews give slightly different low points: 59.302 Hz at about 1:55 a.m. in the UT Energy Institute timeline, and 59.304 Hz at 1:54 a.m. in the FERC and NERC narrative. The FERC and NERC review counts 23,418 MW of manual firm load shed in total.
Interpretation: load shed bought time rather than explaining the frequency fall. Once generation dropped faster than it could be replaced, the remaining question was how fast demand could be reduced before more units tripped.
04Supply: how much generation was offline
The UT Energy Institute timeline reports that offline capacity rose by 24,600 MW in the 24 hours from noon on 14 February to noon on 15 February 2021. Its listed increments, including 13,000 MW for natural gas and 3,700 MW for wind, add to about 21,600 MW, not 24,600 MW, and the timeline does not reconcile the gap.
The FERC and NERC review reports that 81 percent of freeze-related generating unit outages occurred above the units' stated ambient design temperature, and that some ERCOT units still lacked winterization plans. That covers freeze-related outages, not every outage in the event.
Interpretation: the supply figures point to a margin thinner than the plants' design assumed. The UT outage categories, about 30,000 MW for weather, 6,700 MW for fuel and 5,600 MW for equipment, are listed without a measured split of cause, so they cannot divide the total among causes.
05Visibility: when the alarms stop
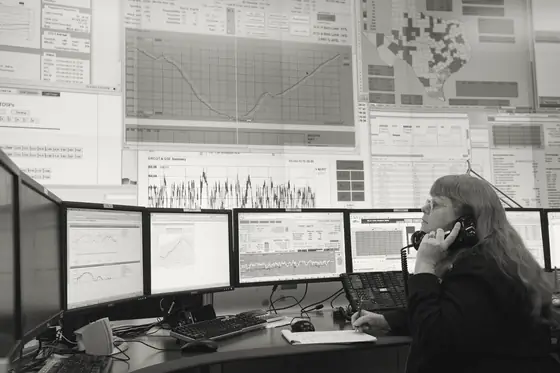
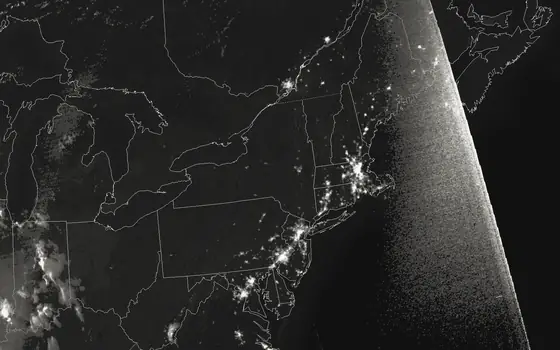
The 2003 timeline mixes equipment failures with failures of the tools operators used. The timeline records bad input data making the MISO state estimator ineffective at 12:15 EDT, during part of the developing event. The alarm and logging software failed at about 14:14 EDT, and three FirstEnergy 345-kV lines failed between 15:05 and 15:57 EDT.
After the alarm system failed, operators did not receive the expected audible and visual warnings of changing equipment conditions. Inadequate vegetation management allowed critical transmission lines to contact trees and trip. The task force grouped the causes around inadequate system understanding, situational awareness, vegetation management and reliability-coordinator support.
Interpretation: silence from an alarm system is reassuring only when the alarm system is known to work. The case's resolution makes the same point: a healthy-looking display is not equivalent to a healthy system.
06How one disturbance becomes system-wide
In Iberia, the systems began losing synchronism with the rest of the European system at 12:33:19, according to the factual report. By 12:33:23.960 the Iberian system was electrically separated after the lines from Spain to France tripped. Automatic load shedding and the system defence plans activated between 12:33:19 and 12:33:22 but could not prevent the collapse.
Interpretation: each automatic step was local, yet each changed the conditions the next step faced. Overvoltage trips removed generation, frequency fell as it was lost, and in 2003 each line loss shifted flows onto the remaining paths.
The factual report of 3 October 2025 gives the timing. The final report of 20 March 2026 revised some of that data and adds the root cause analysis, so timings and causal findings should be read from their own documents.
07What the records do not settle
The Iberian panel could not establish the cause of most overvoltage trips at generation units, so the relative weight of each factor is not settled. The panel does not assign blame to individuals, and this note does not either. For 2003, the final task-force report characterized the blackout as preventable, and the case does not imply that one operator's faster response or one software patch would have guaranteed prevention.
FERC and NERC report at least 210 deaths, mostly in connection with the outages. The Texas Department of State Health Services counts 246 confirmed winter storm-related deaths for 11 February to 4 June 2021, with data current to 27 October 2021. The counts describe storm-related deaths, not which grid failure caused each one.
Interpretation: a death count needs its date, scope and method beside it. This note keeps both Texas counts with their dates, and keeps both frequency readings and the UT total beside its listed increments, rather than choosing one.
Terms in this note
- Voltage control
- The management of voltage so that it stays within what the plants and the network can absorb. The Iberian panel identified its non-effectiveness as the key phenomenon in the 2025 collapse. Glossary
- Firm load shed
- Controlled outages that operators order to keep a grid from a wider collapse. The FERC and NERC review counts 23,418 MW of manual firm load shed in Texas in February 2021. Glossary
- Underfrequency relay
- A protective device that disconnects generating units when system frequency falls below their trip level. In Texas, about 17,000 MW of units were at risk of tripping on such relays within the nine-minute window. Glossary
Test the idea
The case files behind this note

The open record
Sources & further reading
- 1
- 2
- 3Federal Energy Regulatory Commission and North American Electric Reliability Corporation: The February 2021 Cold Weather Outages in Texas and the South Central United States (November 2021; archived copy)
Federal Energy Regulatory Commission and North American Electric Reliability Corporation
- 4University of Texas at Austin, Energy Institute committee: The Timeline and Events of the February 2021 Texas Electric Grid Blackouts (July 2021)
University of Texas at Austin, Energy Institute committee
- 5Texas Department of State Health Services: February 2021 Winter Storm-Related Deaths, Texas (31 December 2021; archived copy)
Texas Department of State Health Services
- 6US–Canada task force — Final blackout report
US–Canada task force
Written for Faultory by Yunus Emre Vurgun, with AI-assisted research and drafting. Editorial standards · Report an issue.