Your browser cannot save progress right now. You can still investigate; keep this tab open or enable local storage to save.
This case has been updated. Compatible choices are kept; revisit the evidence before drawing your conclusion.
01 · The briefing
Begin with the question.
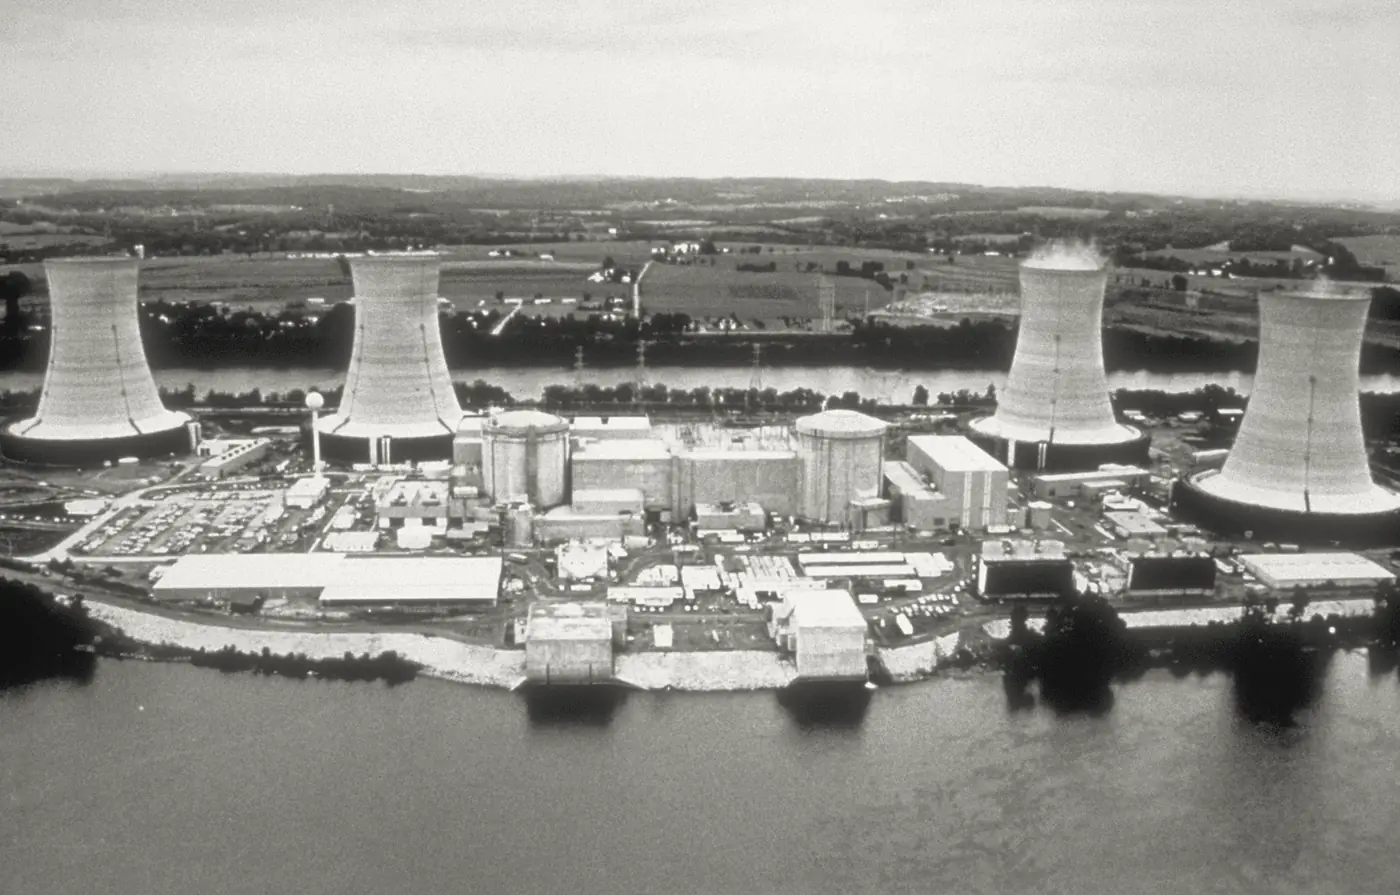
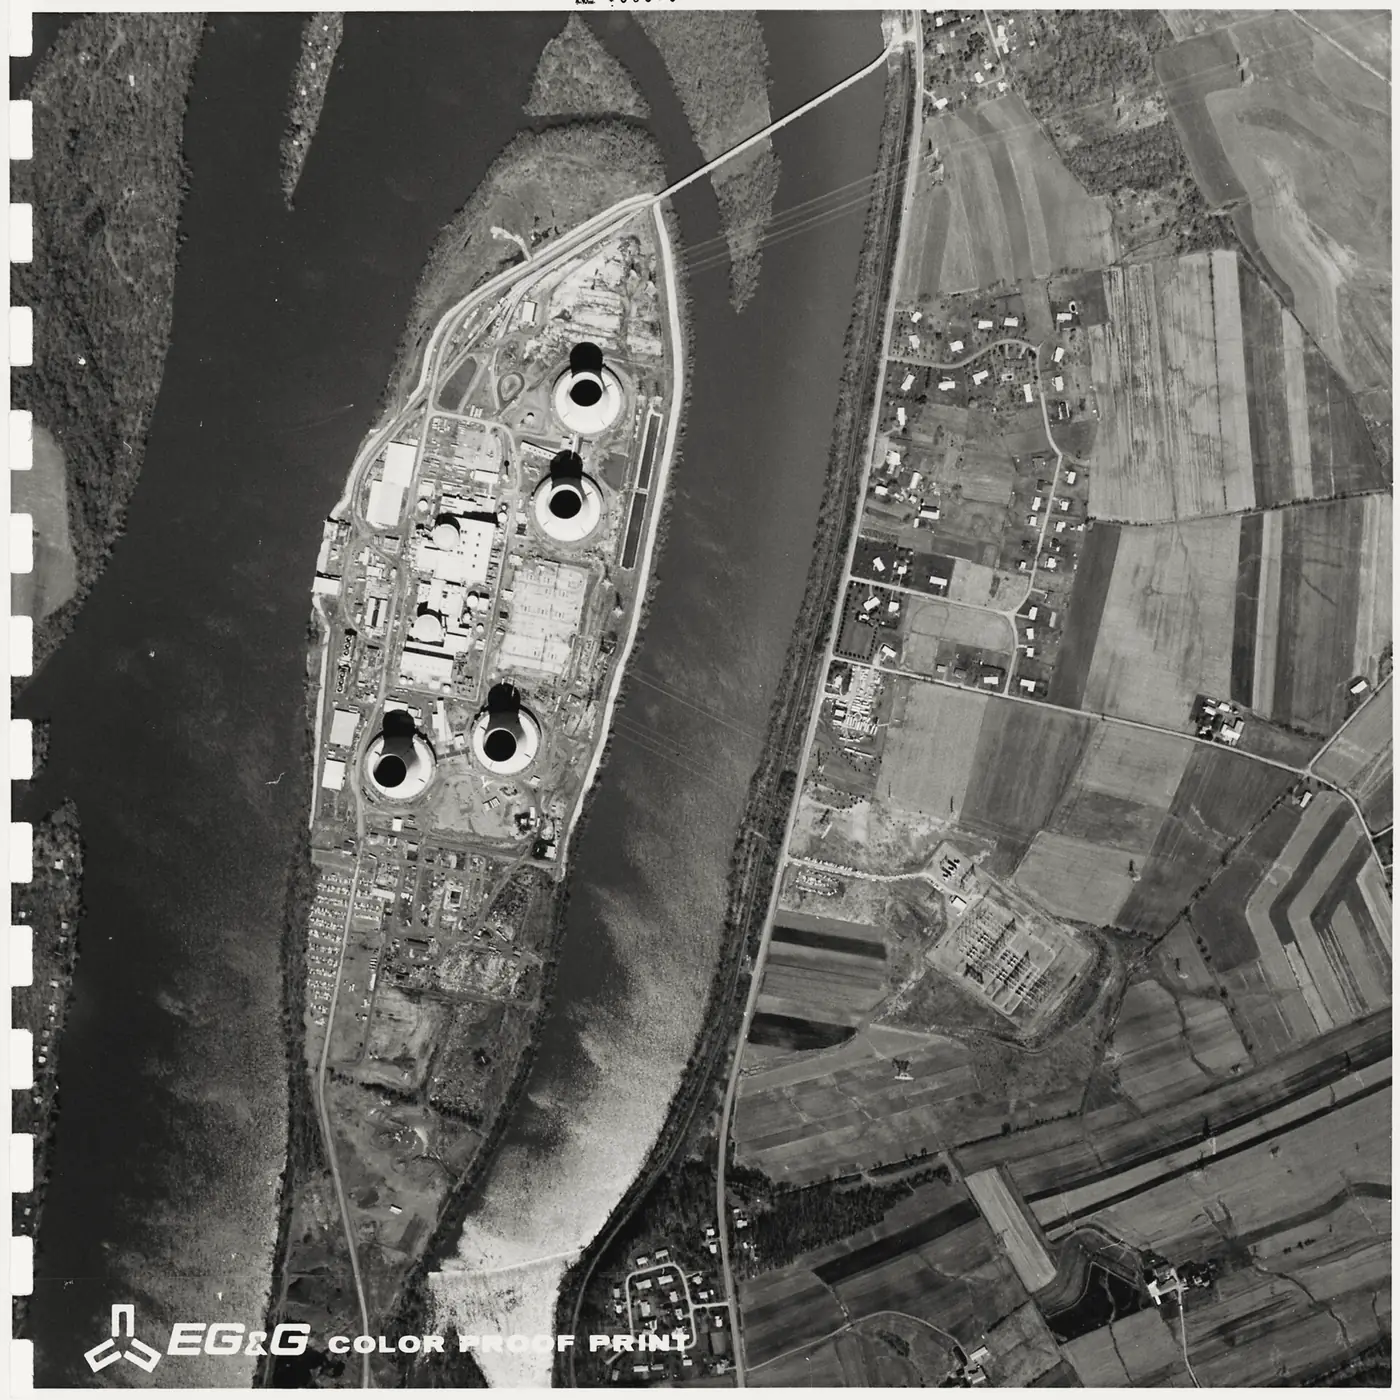
Three Mile Island Unit 2, near Middletown, Pennsylvania, was a pressurized water reactor. At about 4:00 a.m. on 28 March 1979, several water pumps stopped, the turbine and reactor shut down as designed, and pressure in the primary coolant system rose. A pilot-operated relief valve at the top of the pressurizer opened, as it should, but then did not close when the pressure fell. A reasonable observer could point to several causes: the operators, the design, the maintenance history or the regulatory oversight. Public debate also covered how much radiation escaped and what it did to health. Your investigation has to separate what the control room could display from what was actually happening in the primary system. The later investigations drew on plant records, instrument readings and interviews with the operators. Look at the indicator, the pressure and level readings, and the decisions made from them. A useful explanation must account for the length of the coolant loss and for the operators response, without assuming that any single person was the whole cause.
The timeline
After the relief valve stuck open a year earlier at Unit 2, an indicator light is installed in the control room.
Several water pumps stop shortly after 4:00 a.m.; the reactor shuts down, and the relief valve opens and fails to close.
The loss of coolant continues for more than two hours, while high-pressure injection is cut back from about 1,000 gallons per minute to under 100 for extended periods.
The President's Commission on the accident, chaired by John Kemeny, reports on the accident and its causes.
Hatch and colleagues publish a cancer-incidence study near the plant that finds no definite effects of exposure.
Wing and colleagues publish a reanalysis of cancer incidence that reports dose-related associations, with published comments and a reply.
A researched reconstruction for learning. These reasoning steps simplify a complex record; no score can capture the full history.
02 · The evidence
What does the record show?
Read each exhibit before settling on an explanation. The source links below every exhibit lead to the record behind it.
Exhibits reviewed 0 of 5
What the indicator showed
The commission found that the relief valve indicator light showed only that a close signal had been sent, not that the valve was actually closed, and that operators relying on the light did not heed other indications. The report establishes the design of the indicator. It does not describe how each operator interpreted every reading during the first hours.
Source record s1web.archive.org
Throttling high-pressure injection
The commission reports that operators were concerned the plant was going solid, and cut back high-pressure injection from about 1,000 gallons per minute to under 100 for extended periods on 28 March. It concludes that core damage would have been prevented, despite the stuck-open valve, had injection not been throttled. This is the commission's own counterfactual judgment, strongly supported by the record but still an inference.
Source record s1web.archive.org
Radiation monitoring
The EPA history article, written in 1980, describes environmental sampling that began within hours, and a krypton venting that released an estimated 43,000 curies, less than the 57,000 first estimated. Off-site readings during the venting were reported as well below federal safety standards. This is a government monitoring record of releases and readings, not a measure of later health outcomes.
Source record s2web.archive.org
A reanalysis of cancer incidence
Wing and colleagues divided a 10-mile area into 69 tracts, assigned dose estimates, and reported positive associations between accident dose and rates of all cancers, lung cancer and leukemia. The associations are small and depend on modeling choices and latency assumptions. The paper shows that earlier conclusions were not the last word, but it does not establish causation, and it was followed by published comments.
Source record s3pubmed.ncbi.nlm.nih.gov
An earlier study
Hatch and colleagues examined cancers among 159,684 residents within 10 miles, using hospital records for 1975 to 1985 and dispersion models validated against off-site dosimeters. They reported that they failed to find definite effects of exposure. The study is the baseline against which the later reanalysis disagreed, and it does not test every dose assumption used later.
Source record s4pubmed.ncbi.nlm.nih.gov
03 · Your reasoning
Follow the strongest explanation.
Choose an interpretation, then compare it with the evidence. You can revise your choice. The goal is understanding, not a perfect score.
04 · The findings
The chain behind the outcome.
Your notebook
Case report
Next in engineering & technology: Software that replaced the interlocks
The reconstruction turns on an indicator that answered a different question from the one operators needed answered. After the reactor shut down, pressure in the primary system rose and the pilot-operated relief valve opened as designed, but it did not close when pressure fell. The control-room light showed only that a close signal had been sent, so operators concluded the valve had closed. The loss of coolant continued for more than two hours. Other readings were available, but operators read rising pressurizer level as a sign of a filling vessel. Believing the plant was going solid, they cut back high-pressure injection from about 1,000 gallons per minute to under 100 for extended periods, and much of the core was uncovered. The commission judged that core damage would have been prevented, despite the stuck-open valve, had injection not been throttled. Radioactive releases were real but limited; a krypton venting was estimated at about 43,000 curies, with off-site readings below federal standards. The health conclusions are the most contested part. The commission found effects minimal and emphasized mental stress. Wing and colleagues later reported dose-related associations for cancer, while an earlier study had found no definite effects. The established points are the valve state, the indicator design, the throttling and the core damage. The interpretation lies in the health attribution. The durable lesson is that a display showing a command can be mistaken for a state, and that operators need independent indications when the position of a safety valve is uncertain.
Contributing causes and conditions
- A pilot-operated relief valve that opened on a pressure rise and failed to reseat
- A control-room indicator that showed the close command rather than the valve position
- Pressure and level readings that suggested a filling pressurizer rather than a loss of coolant
- High-pressure injection throttled during the loss-of-coolant event, uncovering much of the core
- Procedures that did not make clear that a stuck-open relief valve meant a loss-of-coolant accident unless its block valve was closed
OutcomeThree Mile Island Unit 2 accident
Take the method with you
- An indicator that shows a command can be misread as a state, so ask what it actually measures.
- When one reading conflicts with several others, reconcile them before acting and keep the most dangerous interpretation in view.
- Official conclusions and later reanalyses can both be reported, but the uncertainty in the disputed part should be stated plainly.
You can read findings at any time. Exploring every reasoning step marks this case as complete in your notebook.
The open record
Sources & further reading
Read the original record and its scope before relying on a conclusion. Source references support the exhibit summaries; Faultory’s reasoning prompts are editorial reconstructions.
- s1
- s2
- s3
- s4
Written and curated for Faultory by Yunus Emre Vurgun, with AI-assisted research and drafting. Sources and interpretations can need correction. Read our editorial standards or report an issue.
From the journal
Field notes that use this case
 Alarm floods and silent failures: signals that misleadWarnings fail in two ways: they flood operators, or fall silent while trouble grows. Learn to test whether an indicator shows a state or only a command.
 Automation surprise: when a system does something elseWhen an automated system changes mode or acts on a bad input, the crew must work out what it is doing. Five cases show what made that hard.
Keep investigating