Your browser cannot save progress right now. You can still investigate; keep this tab open or enable local storage to save.
This case has been updated. Compatible choices are kept; revisit the evidence before drawing your conclusion.
01 · The briefing
Begin with the question.
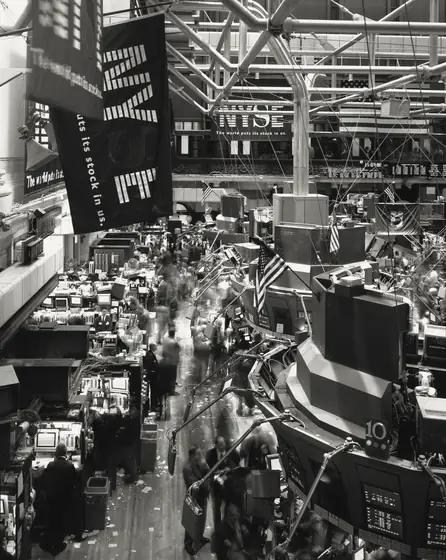
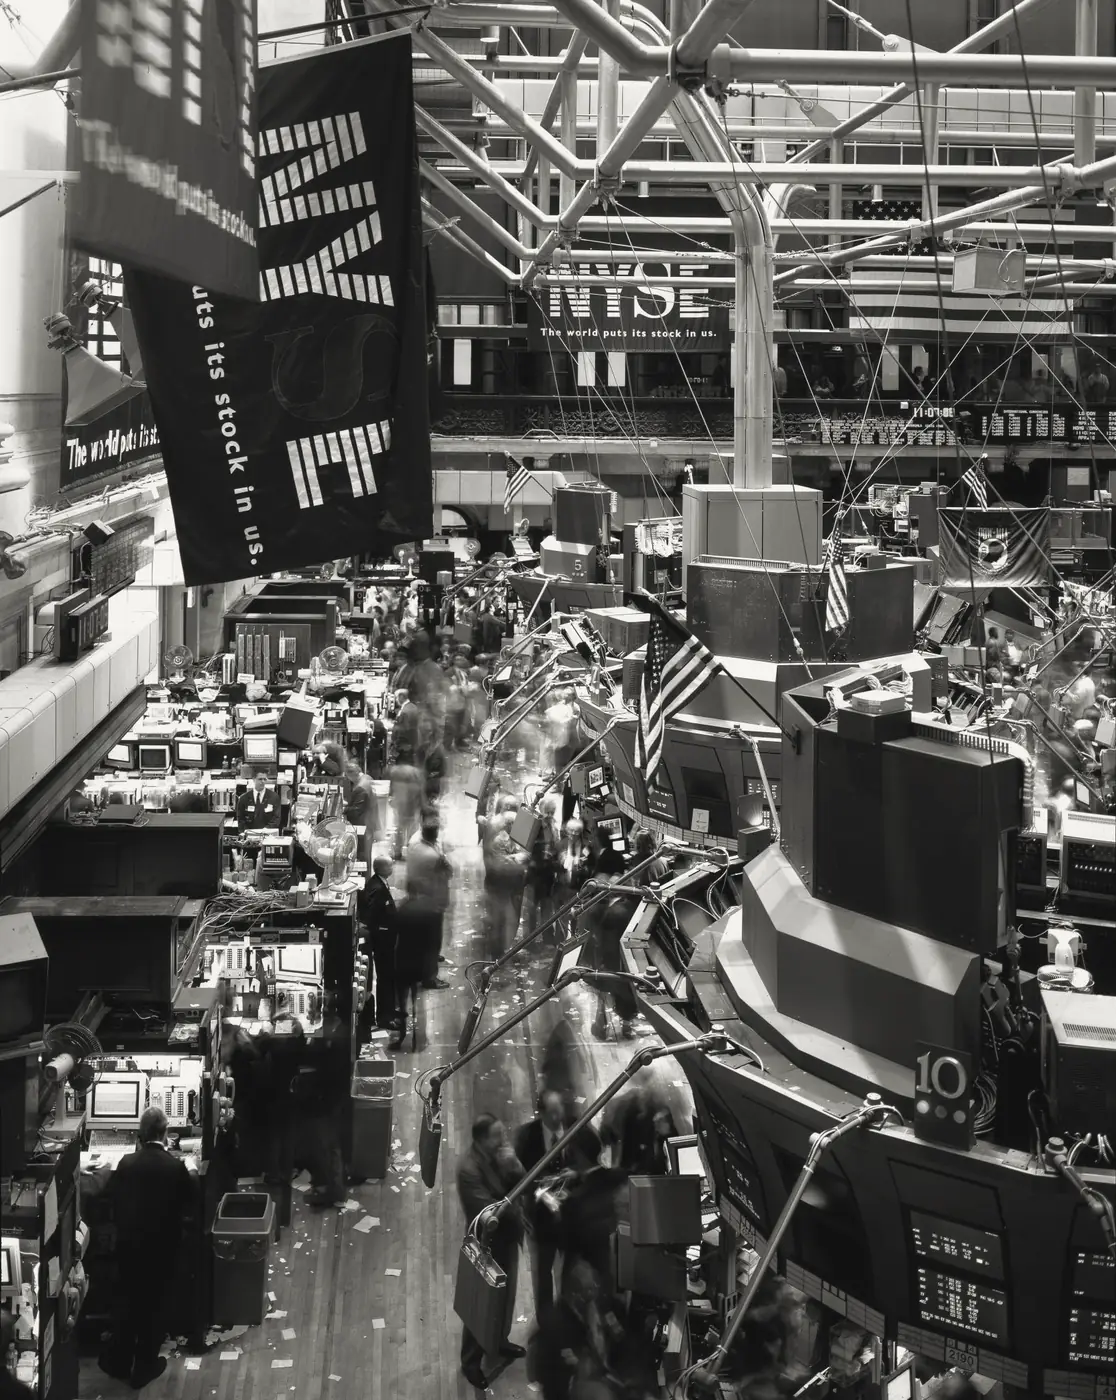
On May 6, 2010, US markets fell sharply and then recovered much of the sudden decline. Your task is to distinguish activity from capacity: a contract can change hands repeatedly without finding an investor willing to hold it. This case follows the September 2010 joint SEC–CFTC staff reconstruction, rather than claiming a final explanation of every participant's contribution. Read the sequence as an interacting system. A trading rule can behave exactly as programmed while responding badly to a changing environment. Ask what the algorithm measures, what it leaves out, and whether that measurement remains meaningful under stress. The question is not whether computers or people are inherently safer. It is which feedback loop the available evidence supports.


The timeline
A large seller begins a 75,000-contract E-mini sell program.
Prices drop rapidly as market depth deteriorates.
CME Stop Logic pauses E-mini trading for five seconds.
The sell program finishes while prices are recovering.
Joint agency staffs date their reconstruction report.
A researched reconstruction for learning. These reasoning steps simplify a complex record; no score can capture the full history.
02 · The evidence
What does the record show?
Read each exhibit before settling on an explanation. The numbered source links below every exhibit lead to the record behind it.
A volume-following rule
The sell algorithm targeted 9% of the previous minute’s trading volume, without a price or time constraint.
Source record [s1]
A thinning book
Near the pause, E-mini buy-side resting orders were below 1% of their morning depth.
Source record [s1]
Turnover is not commitment
The SEC discussion stresses that the size of one order alone does not explain the event; the response of liquidity providers matters.
Source record [s2]
A changing environment
The SEC describes cross-market links and a withdrawal of liquidity, not a stand-alone failure of one exchange.
Source record [s2]
03 · Your reasoning
Follow the strongest explanation.

Choose an interpretation, then compare it with the evidence. You can revise your choice. The goal is understanding, not a perfect score.
04 · The findings
The chain behind the outcome.
The best-supported answer is a liquidity feedback problem, not a shortage of transactions. In the staff reconstruction, selling pressure met a market whose ability to absorb orders was weakening. A rule based on recent turnover could not distinguish durable demand from rapid inventory exchange. Related products also connected the disturbance across markets. The brief trading pause and subsequent recovery belong in the causal account, rather than being treated as an unrelated ending. This does not establish that a single order, trader or technology explains the entire crash. Later investigations examined additional conduct, and this case deliberately stays within the stated 2010 source frame. The transferable reasoning is to inspect the meaning of a control signal under stress. A busy system may be losing resilience even as its activity dashboard looks exceptionally strong.
Take the method with you
- Measure capacity as well as activity.
- Investigate feedback between a rule and its environment.
- Separate a documented reconstruction from a universal single-cause claim.
You can read findings at any time. Exploring every reasoning step marks this case as complete in your notebook.
The open record
Sources & further reading
Read the original record and its scope before relying on a conclusion. Source references support the exhibit summaries; Faultory’s reasoning prompts are editorial reconstructions.
- s1
- s2
Written and curated for Faultory by Yunus Emre Vurgun, with AI-assisted research and drafting. Sources and interpretations can need correction. Read our editorial standards or report an issue.
Keep investigating